 StatSocial analyzed the purchase data for 37 leading apparel brands, and overlaid these insights with the users of Facebook, Instagram, Pinterest, Snapchat, Twitter, and YouTube.
This analysis enabled us to determine which platforms’ users spend the most (or least) on each brand, and report the degrees to which this spending over-indexes or under-indexes against the habits of the average U.S. consumer.
Using StatSocial‘s Silhouette, the industry’s most advanced audience intelligence platform, we discovered that Snapchat and Instagram users spend more on apparel brands than the active users of the other platforms named above.
We’ll examine our findings, and also explain a bit more about who we are. what we do, how we do it, and why our insights are essential, after you have a chance to read the chart.
There are a number of significant insights to break down here.
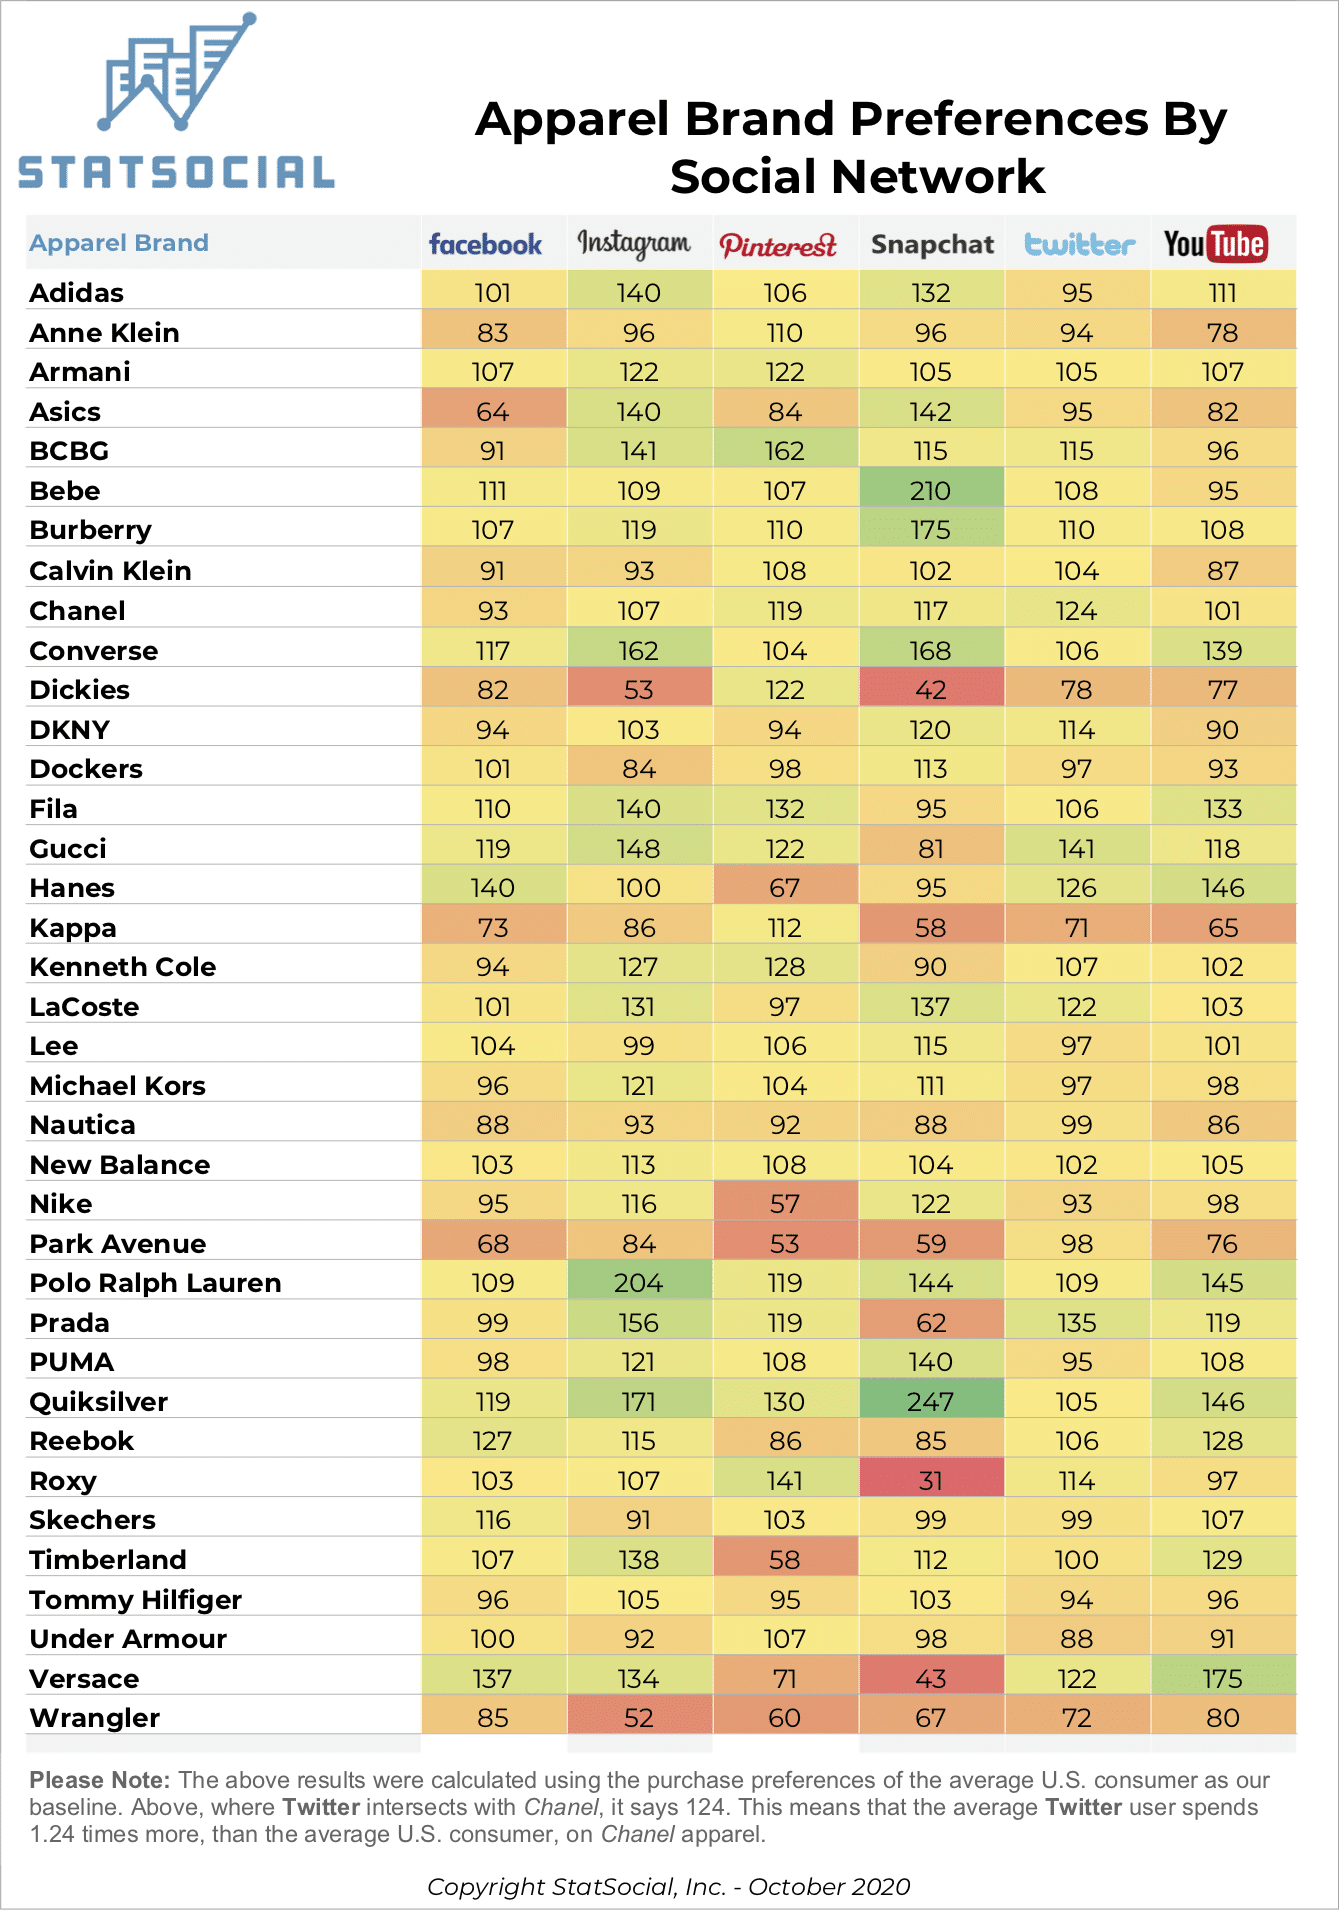
Starting with upmarket items, and fashionable sportswear, Instagram‘s users dedicate the greatest quantities of their funds to these brands, overall. The platform’s average user spends 1.48 times more on Gucci items than the typical U.S. consumer, and on Prada goods, their purchasing exceeds that baseline by 1.56 times.
Those Calabasas, Hidden Hills, and Miami Beach residing influencers, it would seem, do make an impact.
Stylish sportswear brands are also quite popular with users of the photo and video sharing app. They purchase the goods of Adidas, Fila, and Timberland both to degrees comfortably over the index, and beyond the other five social platforms in this sample. Fondnesses for Asics, Converse, and Quicksilver are also apparent.
This is a convenient segue into the purchasing preferences of the average Snapchat user. Starting with the above-mentioned, boardsport-centric Quicksilver, the average user of the messaging platform is spending a dramatic 2.47 times more on the brand’s goods than the average U.S. consumer.
When it comes to women’s retail brand, Bebe, Snapchat is worth highlighting. The app’s users spend over double (2.10 times) the index.
Staying in the sporty lane, Snapchat‘s users spend more than the other five platforms on Converse (over-indexed by1.68 times) and Asics (over-indexed by 1.42).
Going in a completely different direction, Snapchat‘s users massively exceed the other five platforms for purchasing items from the British luxury brand, Burberry. The average user spends 1.75 times more on the brand than the average American consumer.
A number of brands don’t seem to appeal too greatly to any of the users of these platforms. We deal in statistics, of course, but can also observe that some of these brands were downright hot only a short time ago.
Under Armour is sometimes observed as having evolved quickly from a hip, young streetwear brand, to one associated with older consumers, seeking to get and/or remain fit. The company is likely not likely complaining, as they’ve been steadily growing for years. Still, the only platform’s users who are purchasing their goods to a meaningfully over-indexed degree are those of Pinterest.
Nike‘s performance here doesn’t exactly dazzle, although widely available research, as well as what can be plainly observed when being out and about in America, indicates that they remain quite popular with younger consumers. The users of Snapchat spend 1.22 times more on the brand than the average, and the users of Instagram spend 1.16 times more.
The average Facebook user spends well on a diverse assortment of brands. They lay out 1.40 times more money than the average U.S. shopper on the soft, simple t-shirts, undergarments, and casual items of Hanes, and 1.37 times more on the high-end fashion of Versace.
Twitter’s users exceed the index, when it comes to their spending on a handful of the brands featured here; such eclectic names as BCBG, Burberry, Chanel, DKNY, Hanes, and Versace being among them. While the platform’s users stick very close to the index when it comes to the majority of brands, their spending on high-end brands Gucci, Prada, and Versace exceeds the index by 1.41, 1.35, and 1.22 times respectively.
Pinterest‘s users skew heavily female, and slightly older than other platforms, and according to a recent Pew Research study, the platform is of far greater interest to higher-income users. This is consistent with the purchasing habits quantified here. The average user of the image pinning social platform spends 1.22 times over the index on Armani, 1.62 times more on women’s wear line, BCBG, 1.19 times more on Chanel, 1.28 times more on Kenneth Cole, and 1.19 times more on Prada.
Finally, the large array of interests to which YouTube‘s creators cater is reflected in the apparel purchasing habits of the platform’s average users. They spend reasonably-to-very well on stalwart, sporty and/or casual brands such as Adidas, Converse, Hanes, Polo by Ralph Lauren, Fila, Quicksilver, Reebok, and Timberland.
High-end brands are also being purchased by YouTube‘s users, with Gucci and Prada both over-indexing by about 1⅕ times. When it comes to Versace, the average YouTube user spends 1¾ times more than the average American consumer (exceeding the index more than the users of any of the other platforms being examined here).
——————————————————————————————
How It Works
INSIGHTS
When trying to convey the depth, breadth, and scale of StatSocial’s Social Affinity and Earned Media data, we sum it up like this: Imagine an 85,000 question survey given out to 300 million consumers. Now, imagine this already incredible thing as a living, dynamic data set. This survey is being administered in real time, constantly, being continually refreshed to include all of the most up-to-date opinions, choices, affinities, and actions.
Learn more here.
ATTRIBUTION
Marketers and media-sellers know that Earned Media and Influencer Marketing are valuable components of their campaigns. Attributing a definitive worth to either, however, has traditionally been elusive. As StatSocial’s analyses report of with what topics and influencers an audience’s members have been engaging, a marketer can now directly attribute website and offline conversions.
The same metrics that marketers have long relied upon to quantify the value of a campaign’s Paid and Owned Media components, are now just as readily available for Earned Media.
Learn more here.
ACTIVATION
StatSocial’s vast and comprehensive taxonomy is accessible across every programmatic platform. Our partnership with Liveramp, and direct integrations with such leading platforms as Viant, Oracle Data Cloud, Eyeota, and Lotame, finds StatSocial’s insights available everywhere you access audience data.
We are also available, via our 24/7 online to get you the insights and audiences you need, when you need them.
Learn more here.
