Recently we unveiled something brand new for StatSocial — B2B data married to our patented identity graph, made available through our audience intelligence platform Silhouette.
The resulting insights are ready to be leveraged across our key use cases (insights, attribution, and activation). This is an unprecedented opportunity for B2B marketers to analyze more than 40 million business people, including the companies they work for, industries they work in, and job titles, all cross-referenced against Silhouette’s industry-leading insights.
To demonstrate the power of B2B audience data inside of Silhouette, we’ll be sharing a series of entries comparing the employees of tech giants Amazon, Apple, Google, and Microsoft. If you’d like to see similar insights on other B2B data-sets, please contact us.
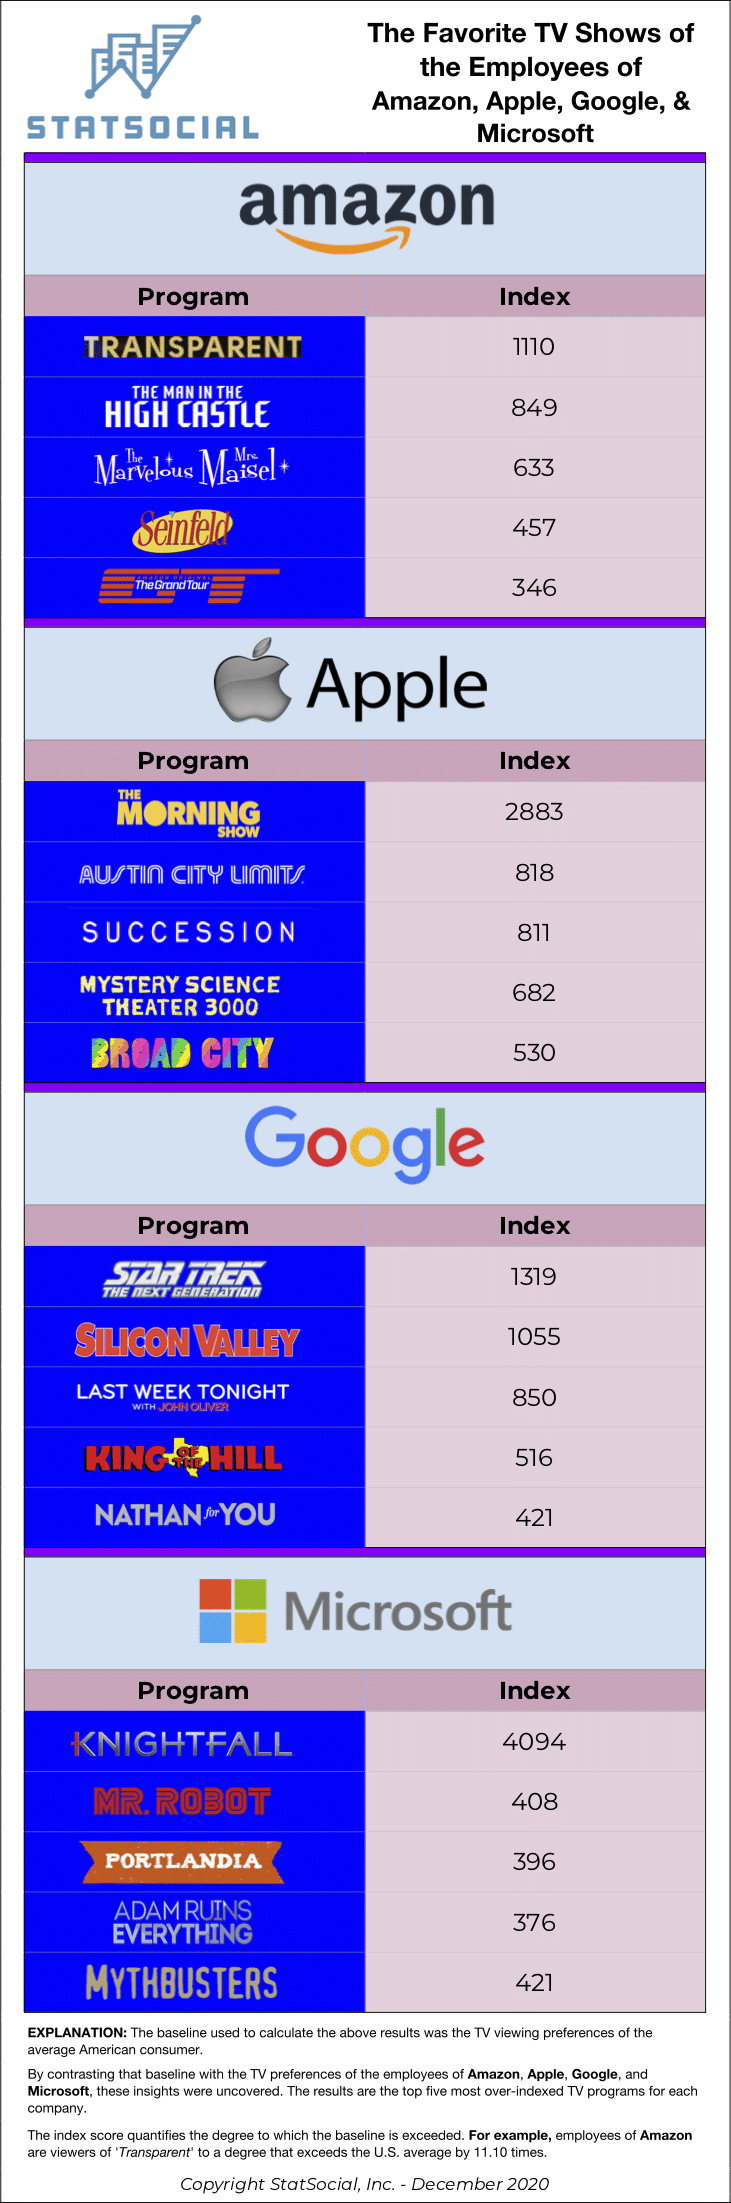
Using Silhouette, we are able to analyze an audience through the lens of nearly 85K insights, many unique to StatSocial. Here, we are focused on preferred television shows.
We’ve learned which five TV programs rate most prominently among the employees of each company, by contrasting their TV viewing preferences with those of the average American consumer. The below infographic reports the results.
Four Amazon Prime streaming series — Emmy winners, ‘Transparent,’ ‘The Marvelous Miss Maisel,’ and ‘The Man in the High Castle,’ as well as ‘The Grand Tour‘ — rate highly among those who work for the service’s parent company. Viewers of ‘Transparent‘ are 11.10 times more likely to be found among this group than among the average American consumer audience.
Apple‘s employees also show preference for their own. Apple TV+‘s Jenifer Aniston and Reese Witherspoon starring, ‘The Morning Show,’ finds favor among the company’s employees to a degree that exceeds the baseline by 28.83 times.
The Google bunch are, in part, Trekkies/Trekkers, with ‘Star Trek: The Next Generation‘ rating as a favorite among their employees to a degree exceeding the U.S. average by 13.19 times.
Finally, the employees of Microsoft are viewers of the History network’s drama, ‘Knightfall’ (a fictionalized telling of the tale of 12th-to-14th century Catholic military order, Knights Templar), to a degree surpassing the baseline by 40.94 times.
——————————————————————————————
How It Works
INSIGHTS
When trying to convey the depth, breadth, and scale of StatSocial‘s Social Affinity and Earned Media data, we sum it up like this: Imagine an 85,000 question survey given out to 300 million consumers. Now, imagine this already incredible thing as a living, dynamic data set. This survey is being administered in real time, constantly, being continually refreshed to include all of the most up-to-date opinions, choices, affinities, and actions. Learn morehere.
ATTRIBUTION
Marketers and media-sellers know that Earned Media and Influencer Marketing are valuable components of their campaigns. Attributing a definitive worth to either, however, has traditionally been elusive. As StatSocial’s analyses report of with what topics and influencers an audience’s members have been engaging, a marketer can now directly attribute website and offline conversions. The same metrics that marketers have long relied upon to quantify the value of a campaign’s Paid and Owned Media components, are now just as readily available for Earned Media. Learn morehere.
ACTIVATION
StatSocial‘s vast and comprehensive taxonomy is accessible across every programmatic platform. Our partnership with Liveramp, and direct integrations with such leading platforms asViant, Oracle Data Cloud,Eyeota, andLotame, finds StatSocial‘s insights available everywhere you access audience data. We are also available, via our 24/7 online to get you the insights and audiences you need, when you need them. Learn morehere.
This is another entry in our series unveiling something brand new for StatSocial .
Our clients now have, at the ready, a mountain of B2B data married to our patented identity graph and audience intelligence platform Silhouette. All of this is ready to be leveraged across our key use cases (insights, attribution, and activation). This is an unprecedented opportunity for B2B marketers to analyze more than 40 million business people, including the companies they work for, industries they work in, and job titles, all cross-referenced against Silhouette’s industry-leading insights.
To demonstrate the power of B2B audience data inside of Silhouette, we’ve been posting these entries comparing the employees of tech giants Amazon, Apple, Google, and Microsoft. If you’d like to see similar insights on other B2B data-sets, please contact us.
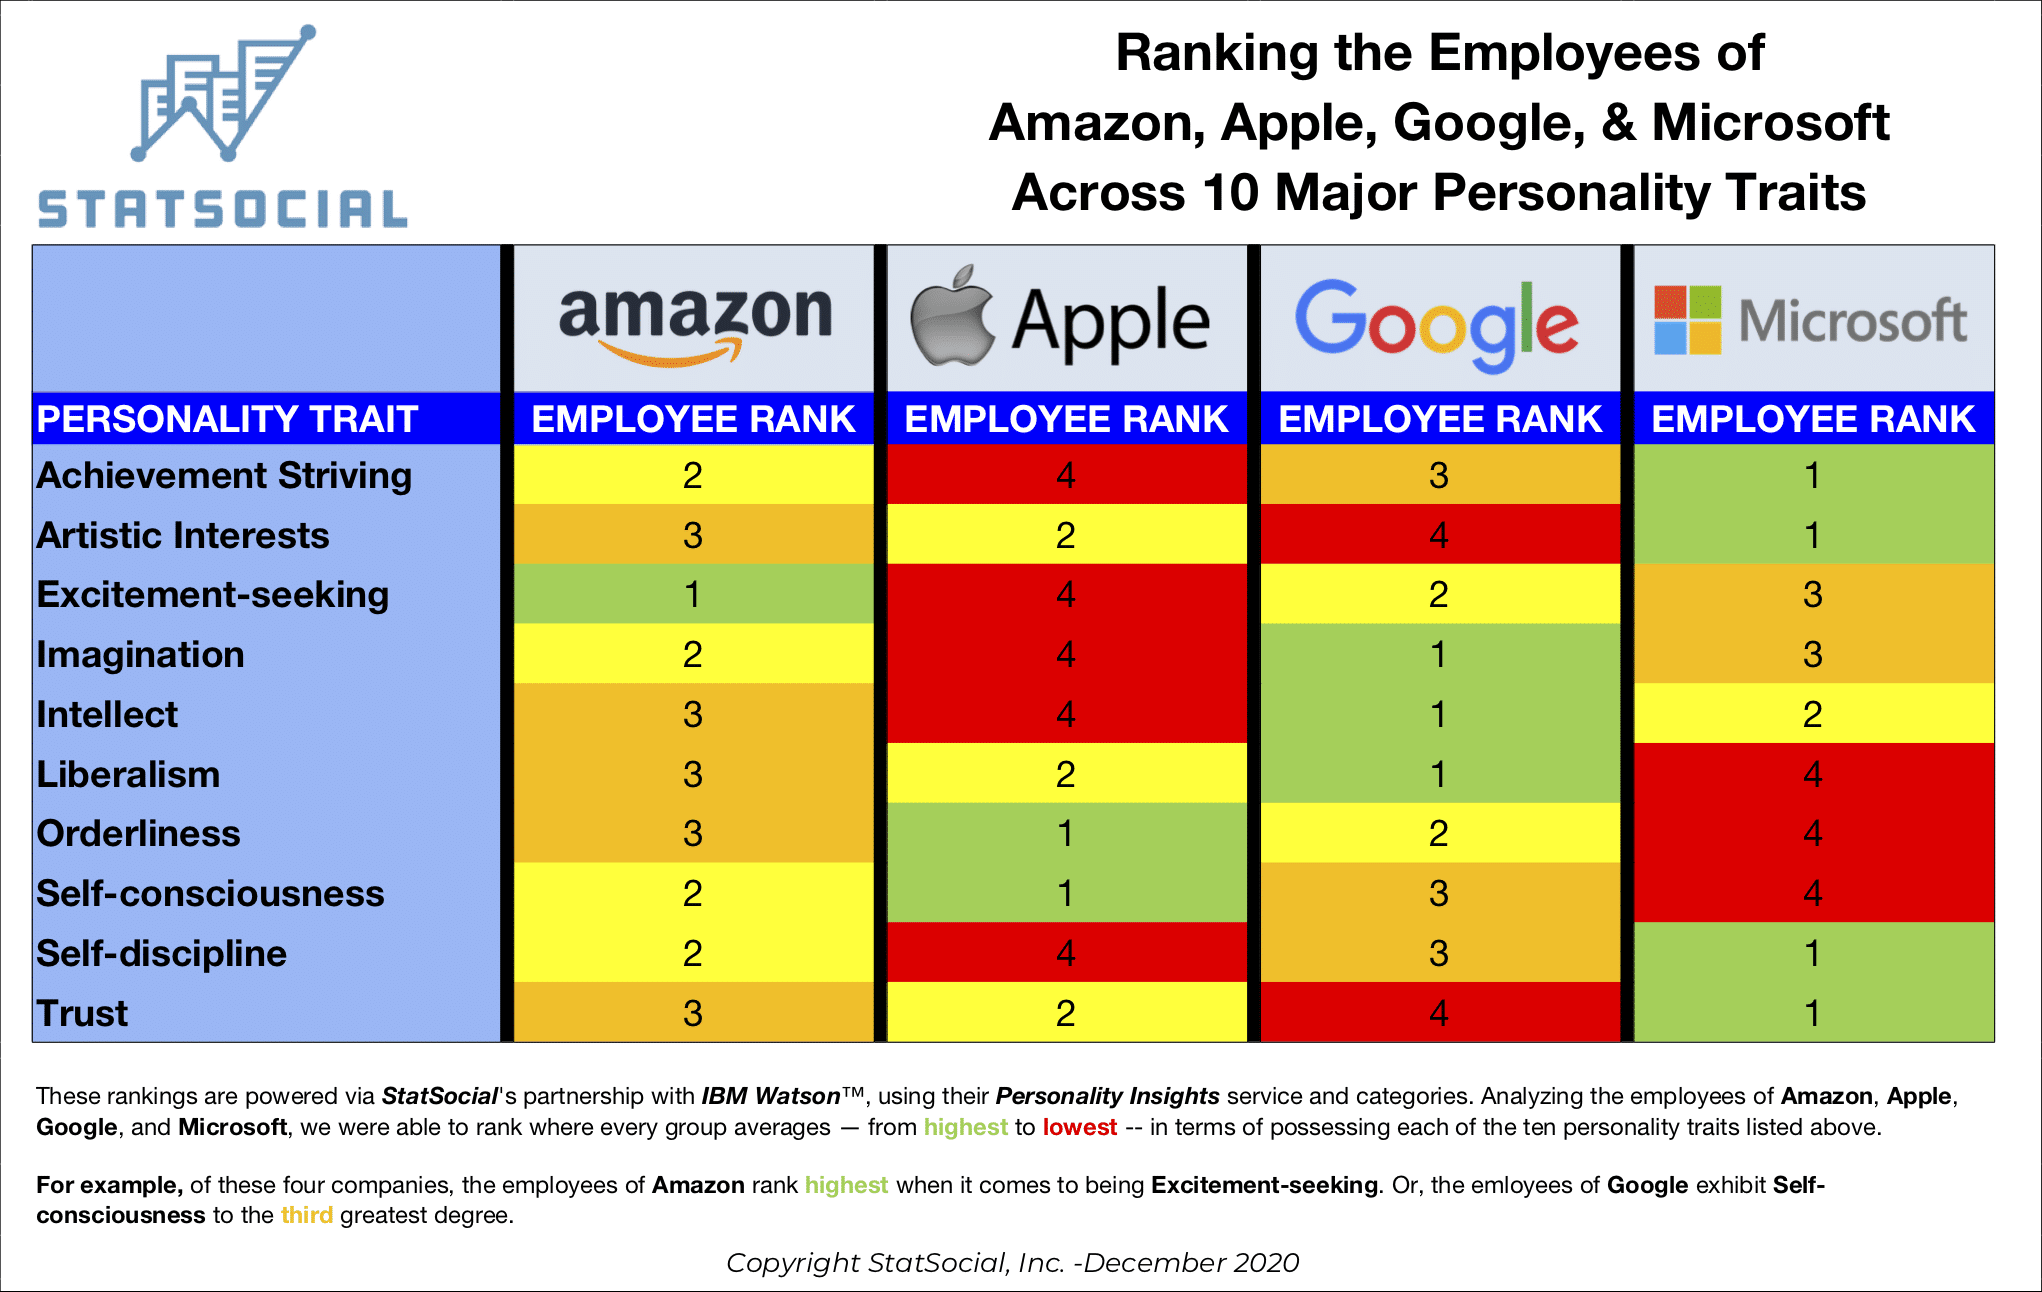
The analysis below was completed by analyzing over 30K employees from each company. For this entry, we’re highlighting one of our most unique sets of insights, here considered through the B2B perspective — provided with a little help from IBM Watson™.
Our Personality Insights are powered by Watson‘s sophisticated AI. When analyzing an individual’s public online writings, Silhouette can infer — with extraordinary and widely-praised accuracy — what personality types dwell within an audience, and in what proportions.
In psychology, the Big 5 personality traits describe a popularly-employed taxonomy that breaks down human personalities into five, broad over-arching categories: Openness, Conscientiousness, Extraversion, Agreeableness, and Neuroticism. Our Personality Insights use this model, with each over-arching umbrella trait housing a number of more granular categories (for example, under Conscientiousness, you will find Cautiousness, Achievement-striving, Dutifulness, and more).
A simple breakdown of the Personality Insights characteristics, and a thumbnail description of each, can be found here. A blog explaining things a bit more in depth can be found here.
The below graphic regards the employees of these Big Tech titans through the lenses of 10 particular characteristics: Achievement-striving, Artistic Interests, Imagination, Intellect, Liberalism, Orderliness, Self-consciousness, Self-discipline, and Trust. We’ve ranked each group, from 1 to 4, indicating which, on average, is most, less, or least likely to exhibit each trait.
——————————————————————————————
How StatSocial Works
INSIGHTS
When trying to convey the depth, breadth, and scale of StatSocial‘s Social Affinity and Earned Media data, we sum it up like this: Imagine an 85,000 question survey given out to 300 million consumers. Now, imagine this already incredible thing as a living, dynamic data set. This survey is being administered in real time, constantly, being continually refreshed to include all of the most up-to-date opinions, choices, affinities, and actions. Learn morehere.
ATTRIBUTION
Marketers and media-sellers know that Earned Media and Influencer Marketing are valuable components of their campaigns. Attributing a definitive worth to either, however, has traditionally been elusive. As StatSocial’s analyses report of with what topics and influencers an audience’s members have been engaging, a marketer can now directly attribute website and offline conversions. The same metrics that marketers have long relied upon to quantify the value of a campaign’s Paid and Owned Media components, are now just as readily available for Earned Media. Learn morehere.
ACTIVATION
StatSocial‘s vast and comprehensive taxonomy is accessible across every programmatic platform. Our partnership with Liveramp, and direct integrations with such leading platforms asViant, Oracle Data Cloud,Eyeota, andLotame, finds StatSocial‘s insights available everywhere you access audience data. We are also available, via our 24/7 online to get you the insights and audiences you need, when you need them. Learn morehere.
Today we are unveiling something brand new for StatSocial — a mountain of B2B data married to our patented identity graph and audience intelligence platformSilhouette. All of this is ready to be leveraged across our key use cases (insights, attribution, and activation). This is an unprecedented opportunity for B2B marketers to analyze more than 40 million business people, including the companies they work for, industries they work in, and job titles, all cross-referenced against Silhouette’s industry-leading insights.
To demonstrate the power of B2B audience data inside of Silhouette, we’ll be sharing a series of entries comparing the employees of tech giants Amazon, Apple, Google, and Microsoft. If you’d like to see similar insights on other B2B data-sets, please contact us.
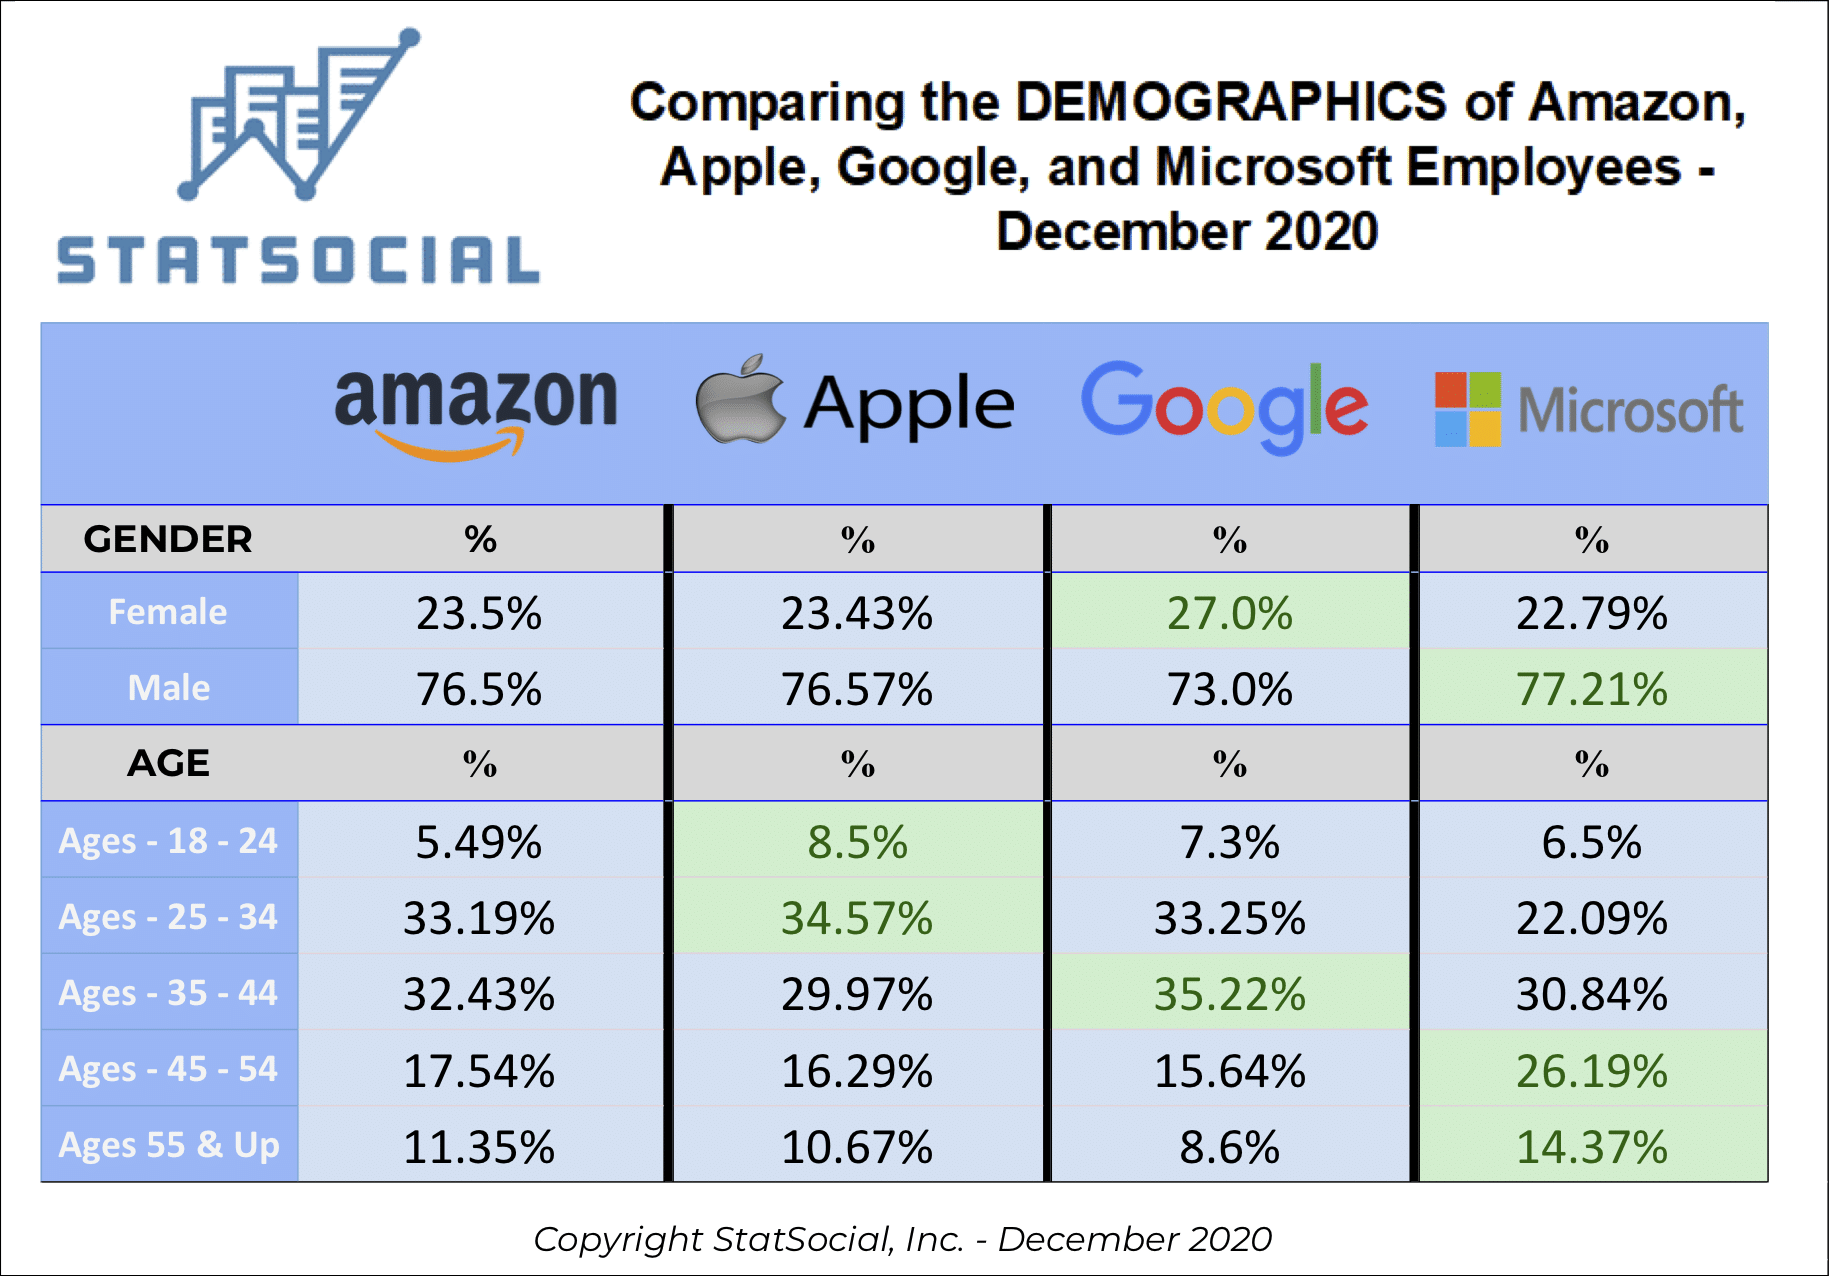
It makes sense to begin with the fundamentals, the gender and age breakdowns of the employee bases across these four tech giants. This analysis was completed by analyzing over 30K employees from each company.
Starting with gender, we know we won’t be shattering any illusions by reporting that each group of employees leans heavily male. In the cases of Amazon, Apple, and Microsoft, women account for less than ¼ of the audiences under our microscope.
Google‘s employees, however, are 27% female.
Next up, ages. Of the four groups, Apple‘s employees contain the largest segment between 18 and 24. The generally younger staffs working at their celebrated and influential retail stores may be a factor. Wherever they may work, however, the company itself reports that over ⅓ of their employees are under 30.
As stated above, and with this much established, we will be digging deeper into these audiences, now that we know the basics. You will be able to find further entries atthe B2B tag on our insights blog, and if you want to dive deeper into StatSocial and Silhouette beyond the B2B, you’re invited toperuse the greater insights blog in general.
——————————————————————————————
How It Works
INSIGHTS
When trying to convey the depth, breadth, and scale of StatSocial‘s Social Affinity and Earned Media data, we sum it up like this: Imagine an 85,000 question survey given out to 300 million consumers. Now, imagine this already incredible thing as a living, dynamic data set. This survey is being administered in real time, constantly, being continually refreshed to include all of the most up-to-date opinions, choices, affinities, and actions. Learn morehere.
ATTRIBUTION
Marketers and media-sellers know that Earned Media and Influencer Marketing are valuable components of their campaigns. Attributing a definitive worth to either, however, has traditionally been elusive. As StatSocial’s analyses report of with what topics and influencers an audience’s members have been engaging, a marketer can now directly attribute website and offline conversions. The same metrics that marketers have long relied upon to quantify the value of a campaign’s Paid and Owned Media components, are now just as readily available for Earned Media. Learn morehere.
ACTIVATION
StatSocial‘s vast and comprehensive taxonomy is accessible across every programmatic platform. Our partnership with Liveramp, and direct integrations with such leading platforms asViant, Oracle Data Cloud,Eyeota, andLotame, finds StatSocial‘s insights available everywhere you access audience data. We are also available, via our 24/7 online to get you the insights and audiences you need, when you need them. Learn morehere.
In this series we’re putting StatSocial, our social media audience insights engine, to work.
We’re checking in on the audiences of some of those companies whose names will be familiar to any regular podcast listener, as they are among the most prominent sponsors of many of the most popular podcasts.
What are we trying to determine? Above all else, for which brands do the most passionate members of these podcasts’ audiences show the strongest affinities? StatSocial scores audience affinities for 1,000 top podcasts in every audience report. In this series, we’ll show you the top-five podcasts audiences that are best aligned to the brand in question.
For marketers and agencies looking to optimize podcast ad spend, StatSocial is an indispensable tool. StatSocial also works for podcast ad sellers and networks looking to best position their podcast properties to the right advertisers. This article is a window into what StatSocial can uncover for ad buyers and sellers of all sorts.
(You can check out parts 1 and 2 in this series here and here.)
— — — — — — — — — — — — — — — — —
Founded in 1995 and acquired by Amazon in 2008 for $300 million, the Newark, N.J. headquartered Audible is one of the world’s largest vendors of audiobooks, downloadable radio and TV programs, and audio versions of magazines and newspapers.
Through their Audible Studios they are also the world’s largest producer of audiobooks.
The male to female split among this audience is virtually straight down the middle (leaning toward 51% male to 49% female).
1) Grammar Girl: Quick & Dirty Tips For Better Writing
Former science writer, and current professor of journalism at the University of Nevada, Reno, Mignon Fogarty’s grammar tips are likely something most of us have encountered at one time or another.
Were you trying to steer clear of a homonym mishap and Google’d the matter to keep things straight? The Grammar Girl site is very possibly the first link upon which you clicked.
Podcasting Hall of Fame inductee, Fogarty has founded an entire Quick and Dirty Tips network, dedicated to helping us all be more productive, efficient, and knowledgeable. The network features experts on a vast variety of topics including parenting, health and fitness, pet care, and real estate.
Ms. Fogarty’s self-help empire, however, was built on the back of her terrifically handy writing site and podcast. Audible’s crowd would no doubt tend toward the literate, as those without such inclinations would no sooner listen to a book than read one. It is therefore not all that surprising that the degree to which Grammar Girl fans reside among the Audible audience exceeds the average by just shy of 36 times.
6.01% of the dedicated Audible users we analyzed have recently discussed or shared content related to Grammar Girl compared to .167% of Americans.
2) Happier With Gretchen Rubin
Gretchen Rubin is a best-selling author and self-help guru. Her Happier podcast builds upon the themes of all her books, but most especially her ‘The Happiness Project,’ detailing a year-long, concerted quest for happiness and what she learned along the way. The book spent two years on the New York Times bestseller list.
Trained as an attorney, she was working as a clerk to Supreme Court Justice Sandra Day O’Connor when she realized she wanted to be a writer.
The Happier podcast finds favor among a proportion of this gang 16 times greater than the norm.
1.54% of the dedicated Audible users we analyzed have recently discussed or shared content related to the Happier podcast compared to .094% of Americans.
3) Side Hustle School
Professor Guillebeau’s school of side hustlin’ finds love here to an extent exceeding the average by 16 ¼ times.
This is not the first time we’ve seen this podcast grace a list in this series of entries. You’ll find it referenced here as well.
1.62% of the dedicated Audible users we analyzed have recently discussed or shared content related to the Side Hustle School podcast compared to .167% of Americans.
4) Planet Money
Planet Money first came to life via NPR in the wake of the 2008 banking crisis, intent on explaining the economy to those confused. You’re over 14 ½ times more likely to find members of its audience among the Audible zealots than you are the greater social media masses.
2.95% of the dedicated Audible users we analyzed have recently discussed or shared content related to Planet Money podcast compared to .202% of Americans.
5) Freakonomics Radio
Steven Levitt is a University of Chicago economist, who wrote, along with New York Times journalist Stephen Dubner, the book upon which this podcast is based, ‘Freakonomics: A Rogue Economist Explores the Hidden Side of Everything.’ The pair now co-host the Freakonomics Radio podcast, continuing the exploration of Levitt’s holistic application of economic theories.
The book has sold over 4-million copies worldwide, and the podcast had found purchase in the hearts and minds of these audiobook devotees to a degree exceeding the average social media Joe and Jane by 13 ¾ times.
4.04% of the dedicated Audible users we analyzed have recently discussed or shared content related to Freakonomics podcast compared to .293% of Americans.
Head to the greater StatSocial Insights blog by clicking here, and check out our exploration of more podcast sponsors, as well as a number of other topics into which we’re the best qualified to take the deep dive.
We use cookies on our website to give you the most relevant experience by remembering your preferences and repeat visits. By clicking “Accept All”, you consent to the use of ALL the cookies. However, you may visit "Cookie Settings" to provide a controlled consent.
This website uses cookies to improve your experience while you navigate through the website. Out of these, the cookies that are categorized as necessary are stored on your browser as they are essential for the working of basic functionalities of the website. We also use third-party cookies that help us analyze and understand how you use this website. These cookies will be stored in your browser only with your consent. You also have the option to opt-out of these cookies. But opting out of some of these cookies may affect your browsing experience.
Necessary cookies are absolutely essential for the website to function properly. These cookies ensure basic functionalities and security features of the website, anonymously.
Cookie
Duration
Description
cookielawinfo-checkbox-analytics
11 months
This cookie is set by GDPR Cookie Consent plugin. The cookie is used to store the user consent for the cookies in the category "Analytics".
cookielawinfo-checkbox-functional
11 months
The cookie is set by GDPR cookie consent to record the user consent for the cookies in the category "Functional".
cookielawinfo-checkbox-necessary
11 months
This cookie is set by GDPR Cookie Consent plugin. The cookies is used to store the user consent for the cookies in the category "Necessary".
cookielawinfo-checkbox-others
11 months
This cookie is set by GDPR Cookie Consent plugin. The cookie is used to store the user consent for the cookies in the category "Other.
cookielawinfo-checkbox-performance
11 months
This cookie is set by GDPR Cookie Consent plugin. The cookie is used to store the user consent for the cookies in the category "Performance".
viewed_cookie_policy
11 months
The cookie is set by the GDPR Cookie Consent plugin and is used to store whether or not user has consented to the use of cookies. It does not store any personal data.
Functional cookies help to perform certain functionalities like sharing the content of the website on social media platforms, collect feedbacks, and other third-party features.
Performance cookies are used to understand and analyze the key performance indexes of the website which helps in delivering a better user experience for the visitors.
Analytical cookies are used to understand how visitors interact with the website. These cookies help provide information on metrics the number of visitors, bounce rate, traffic source, etc.
Advertisement cookies are used to provide visitors with relevant ads and marketing campaigns. These cookies track visitors across websites and collect information to provide customized ads.