Below you’ll find the weekly update, courtesy of StatSocial’s Crisis Insights service, tracking and ranking each state based on engagement with online discussions of COVID-19.
For those new to Crisis Insights: The subscription service has been built using StatSocial’s Silhouette™ social data platform. The service is a tool for brands, marketers, and agencies seeking to understand the rapidly changing dynamics of their customers who, as a result of the uncertainty born of the COVID-19 pandemic, are finding their customer dynamics shifting during these trying times.
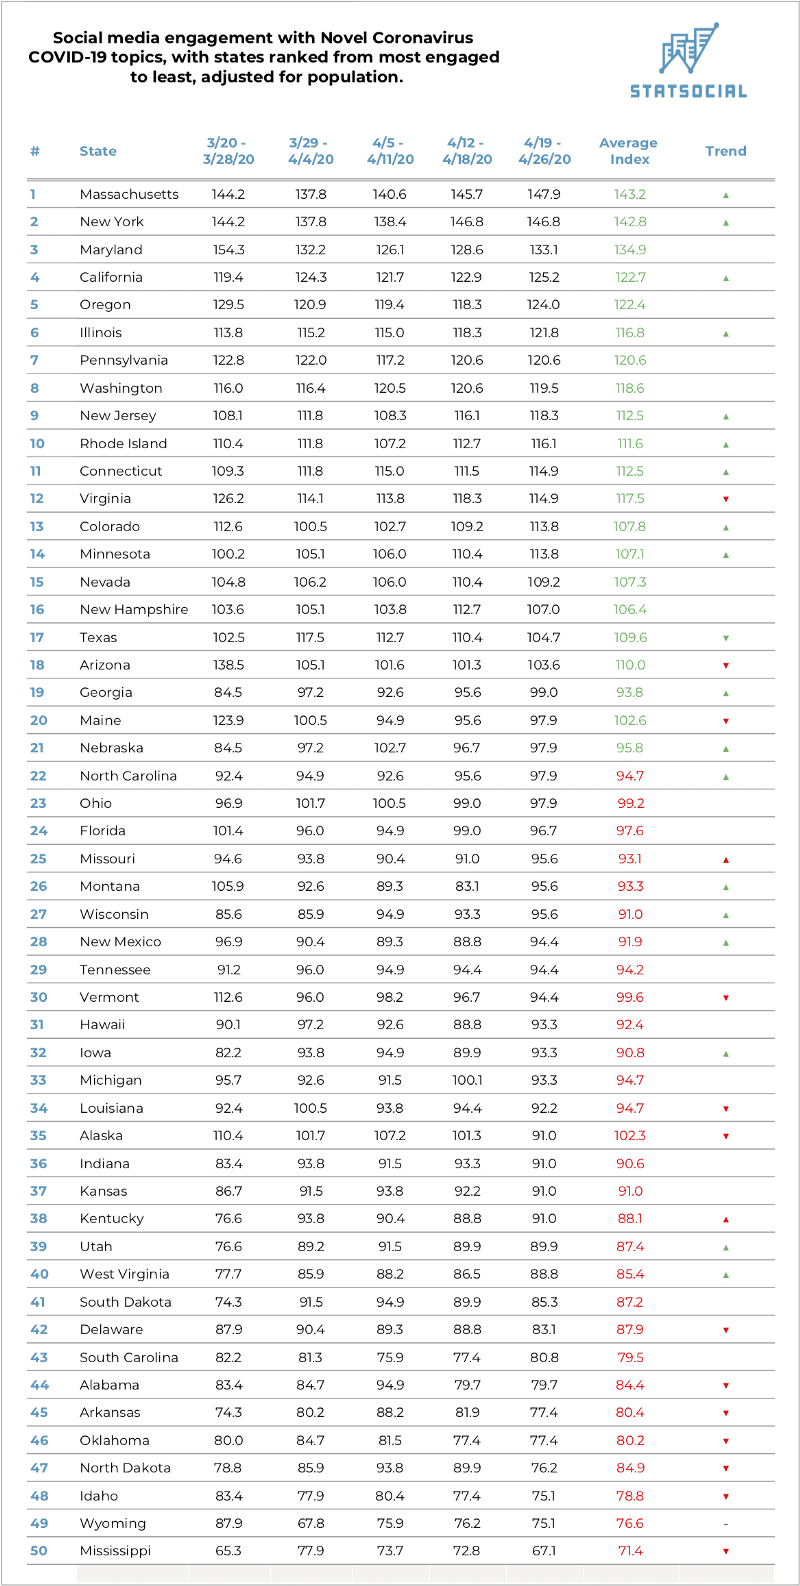
The 50 United States, ranked by online engagement with Novel Coronavirus / COVID-19 topics, from most engaged to least
Explanation of the above data: The scores on the above chart are index scores. Used for convenience here, these scores summarize, at-a-glance, the degrees to which social media content related to novel coronavirus / COVID-19 topics have been engaged with by the residents of each state.
The index scores are calculated based on contrasting the above described statistics with the entire United States population’s engagement with novel coronavirus / COVID-19 topics. A level score of 100 is used to represent this national number, and the scores on the above graphic report the degrees to which each state’s engagement is in excess of or is equal to (represented in green), or falls short of (represented in red) that baseline.
Each state’s engagement has been broken out by week (the first three to have transpired since Crisis Insights’ launch). This allows you to see how engagement has increased, decreased, or held steady week-to-week.
The data used for Crisis Insights’ reporting is collected and analyzed daily, and then reported to subscribers as rolling seven and 30-day averages (as well as a full data series).
In addition to the insights shared here — regarding where each state’s residents stand when it comes to engagement with topics surrounding the COVID-19 matter — this also offers a small glimpse into how our constantly revised, amended, and well-presented reporting allows brands to observe, compare, and retain context for customer behaviors, concerns, affinities, etc., as they shift, change, and are even replaced over the coming weeks and months.
Massachusetts, whose residents have been consistently seeking out and engaging with news, articles, and discussions pertaining to the epidemic, and the many related topics surrounding it, are currently topping the list. Engagement with novel coronavirus/COVID-19 related content has been trending upward.
The Commonwealth has had to deal with the third largest number of confirmed cases, and has endured the fourth largest number of fatalities. Just this past week, the state suffered the highest single-day death toll since the start of the outbreak. They’ve also been battling new, confirmed cases at a rate greater than any other state.
New York, which remains, by a vast margin, the hardest hit state in the country — with over 305,000 residents confirmed to have contracted the virus, and over 23,000 deaths — also finds its citizens consistently engaging with online content related to the whole matter. New Yorkers find their engagement overall trending upward.
While new hospitalizations and, even more gratefully, new deaths from the virus have been, mostly steadily, trending downward, New Yorkers are clearly making a point of remaining vigilant, and staying informed.
Maryland remains notable as engagement with content related to the crisis, at first glance, appears proportionally far larger than the degree to which the state’s residents have been hard hit. The state, though, has still been contending with an overall increasing number of new cases, finding them the third hardest hit state at this moment, in terms of trying to find success with “flattening the curve.”
Alaska, the state with the fourth smallest population in the country, had found its residents rather actively consuming and engaging with online content related to the epidemic, and the many related topics and concerns that have arisen with it. That engagement had been, however, steadily trending downward, and as of this update has really dropped off.
Also dropping off, however, is the number of confirmed cases and fatalities from the virus among Alaskans. The former number is the lowest of all states, and the latter, single-digit figure, one of the very smallest.
The state whose residents are the least engaged with content regarding the the novel coronavirus, COVID-19, and all related matters, remains Mississippi. Notable here, because although the rate at which new cases are being confirmed remains, more or less, steady, engagement with content regarding the topic has dropped off a fair bit, and finds the overall trend a downward one.
What are Crisis Insights?
Crisis Insights provides subscribers with near real-time updates on how the unprecedented climate in which we all find ourselves is affecting consumer sentiment, both among the general public, as well as a brand’s specific customers.
Changes in consumer sentiment are tracked in this reporting, for 32 crisis-related segments, across four general categories:
People concerned about the Covid-19 epidemic
People concerned about the direction of the economy
People coping and adjusting to the ‘new normal’ environment
General attitudes and psychographic outlook of the population
With that we encourage you to continue to revisit the blog for more insights of this nature, including our weekly updates of this chart.
And most importantly, we hope that you and yours are remaining as safe and healthy as your situations allow. Please be well.
We encourage you to visit these previously shared Crisis Insights related posts:
Please note: Many of the data points featured in the below entries will have changed and evolved in the weeks since the entries were first posted (as is the way with our Crisis Insights reporting). We believe these links are still worth checking out as they illustrate more fully the nature of what kinds of statistics Crisis Insights offers, and how they can be put to use meaningfully.
Below you’ll find the weekly update, courtesy of StatSocial’s Crisis Insights service, tracking and ranking each state based on engagement with online discussions of COVID-19.
For those new to Crisis Insights: The subscription service has been built using StatSocial’s Silhouette™ social data platform. The service is a tool for brands, marketers, and agencies seeking to understand the rapidly changing dynamics of their customers who, as a result of the uncertainty born of the COVID-19 pandemic, are finding their customer dynamics shifting during these trying times.
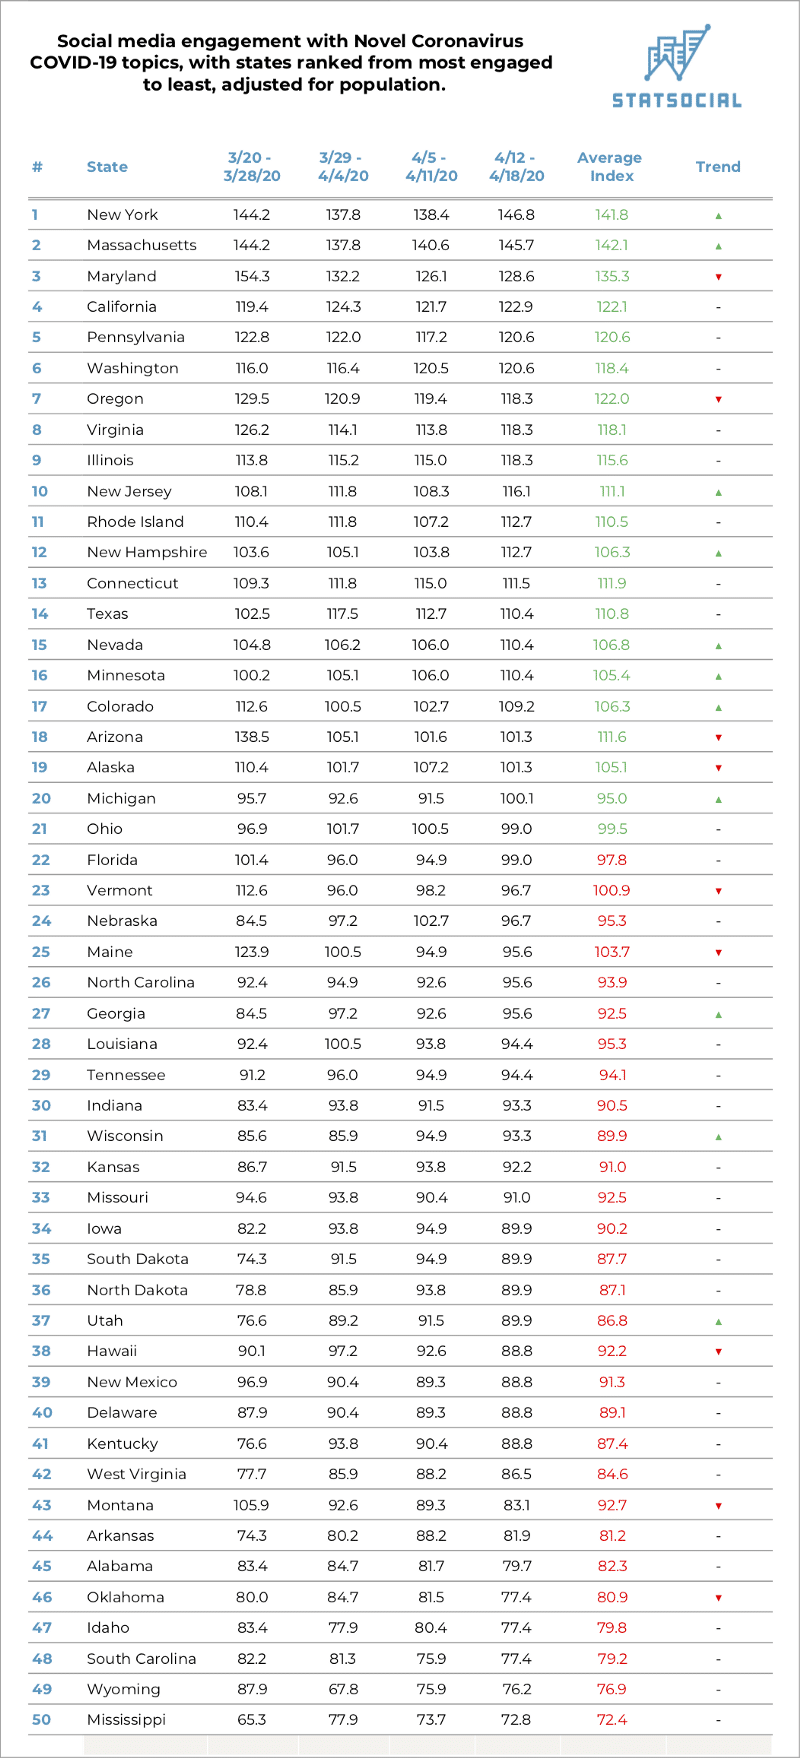
The 50 United States, ranked by online engagement with Novel Coronavirus / COVID-19 topics, from most engaged to least
Explanation of the above data: The scores on the above chart are index scores. Used for convenience here, these scores summarize, at-a-glance, the degrees to which social media content related to novel coronavirus / COVID-19 topics have been engaged with by the residents of each state.
The index scores are calculated based on contrasting the above described statistics with the entire United States population’s engagement with novel coronavirus / COVID-19 topics. A level score of 100 is used to represent this national number, and the scores on the above graphic report the degrees to which each state’s engagement is in excess of or is equal to (represented in green), or falls short of (represented in red) that baseline.
Each state’s engagement has been broken out by week (the first three to have transpired since Crisis Insights’ launch). This allows you to see how engagement has increased, decreased, or held steady week-to-week.
The data used for Crisis Insights’ reporting is collected and analyzed daily, and then reported to subscribers as rolling seven and 30-day averages (as well as a full data series).
In addition to the insights shared here — regarding where each state’s residents stand when it comes to engagement with topics surrounding the COVID-19 matter — this also offers a small glimpse into how our constantly revised, amended, and well-presented reporting allows brands to observe, compare, and retain context for customer behaviors, concerns, affinities, etc., as they shift, change, and are even replaced over the coming weeks and months.
The top ranked state this week is the state StatSocial calls home, and the one hardest hit by the virus (both in terms of diagnosed cases and fatalities). For residents of New York, and especially New York City, there is a very real need to keep up to date on the day-to-day developments around the virus, and the sharp economic downturn that came along with its arrival. This news is of importance to everyone right now, of course, but there is an additional practical urgency for New York’s residents.
This is why its not at all surprising to see that, while topping the list, consumption of discussion and content related to the Novel Coronavirus crisis is only trending upward among the state’s citizens.
As of this week, the degree of engagement among the Empire State’s residents exceeds the national average by 1.418 times. The week of 4/12 to 4/18/20 has seen found the state consuming, interacting, and/or engaging with COVID-19 related content to the greatest degree to date.
Massachusetts (the top ranked state last week) is ranked second here. The state’s citizens have been engaging with online content pertaining to the virus, and all related matters, to a degree exceeding the baseline by 1.412 times.
The week of 4/12 to 4/18/20 was the state’s highest week of engagement to date, and in an overall way the state’s engagement is trending upward.
Maryland — the state with the 13th most diagnosed cases, 7th most confirmed deaths — is ranked 3rd here, but engagement has been steadily trending downward.
Michigan experienced the third largest number of new fatalities last week (after New York and New Jersey), and has also contended with the third largest number overall. Engagement among the state’s residents is trending upward,
Utah, the state with the 30th most diagnosed cases (and 29th most new cases as of the past week), and 44th highest number of confirmed deaths from the virus, finds its engagement overall trending upward. The state’s week of highest engagement to date was the week of 4/5 to 4/11/20.
Mississippi, retains its position as the state with the lowest degree of engagement from last week. Averaging the engagement trends of the last three weeks indicated on the above chart shows that engagement has been trending downward, with the week of 4/12 to 4/18/20 showing an especially sharp increase.
Wisconsin, which is ranked 31st above, finds engagement among its residents decidedly trending upward. To date, the state has the 26th largest number of overall diagnosed cases and the 19th largest number of confirmed fatalities.
We eagerly invite you to visit our Crisis Insights page here, and to reach out to us to learn a great deal more about the service, and to check out a demo.
As before, and as always, we sincerely hope that all reading are doing as well as circumstances allow, and are safe.
What are Crisis Insights?
Crisis Insights provides subscribers with near real-time updates on how the unprecedented climate in which we all find ourselves is affecting consumer sentiment, both among the general public, as well as a brand’s specific customers.
Changes in consumer sentiment are tracked in this reporting, for 32 crisis-related segments, across four general categories:
People concerned about the Covid-19 epidemic
People concerned about the direction of the economy
People coping and adjusting to the ‘new normal’ environment
General attitudes and psychographic outlook of the population
With that we encourage you to continue to revisit the blog for more insights of this nature, including our weekly updates of this chart.
And most importantly, we hope that you and yours are remaining as safe and healthy as your situations allow. Please be well.
We encourage you to visit these previously shared Crisis Insights related posts:
We return to this blog today to share more insights reported by StatSocial’s Crisis Insights service. This particular chart will be updated on a weekly basis, each Monday/Tuesday.
For those new to Crisis Insights: The subscription service has been built using StatSocial’s Silhouette™ social data platform. The service is a tool for brands, marketers, and agencies seeking to understand the rapidly changing dynamics of their customers who, as a result of the uncertainty born of the COVID-19 pandemic, are finding their customer dynamics shifting during these trying times.
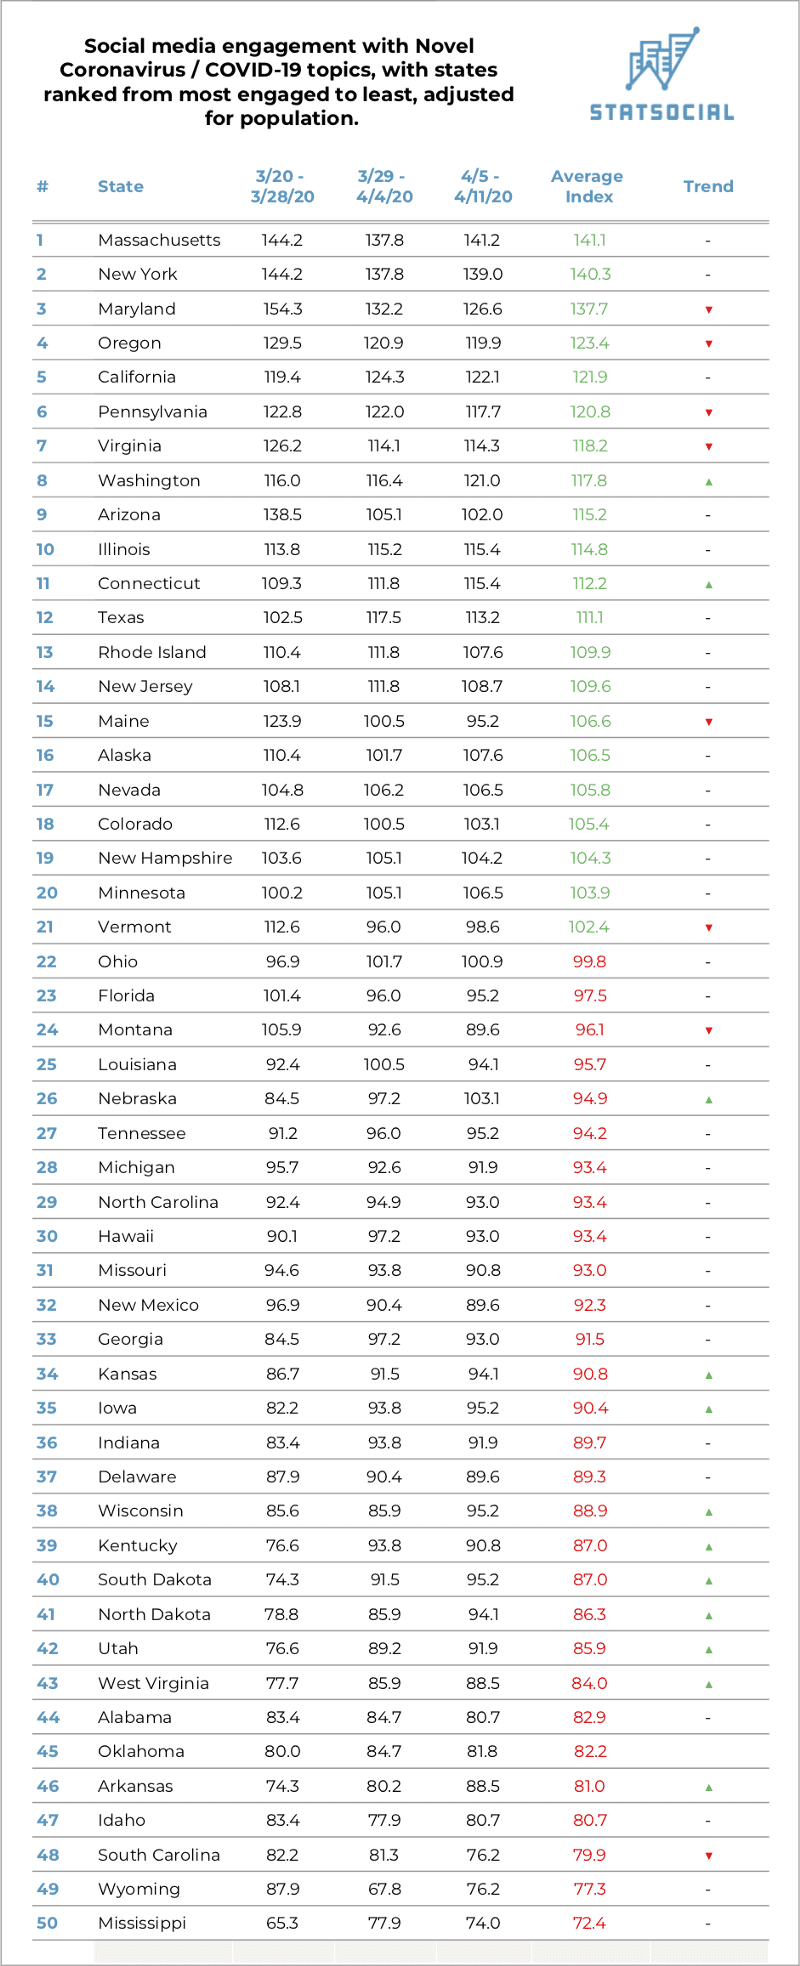
The 50 United States, ranked by online engagement with Novel Coronavirus / COVID-19 topics, from most engaged to least
Explanation of the above data: The scores on the above chart are index scores. Used for convenience here, these scores summarize, at-a-glance, the degrees to which social media content related to novel coronavirus / COVID-19 topics have been engaged with by the residents of each state.
The index scores are calculated based on contrasting the above described statistics with the entire United States population’s engagement with novel coronavirus / COVID-19 topics. A level score of 100 is used to represent this national number, and the scores on the above graphic report the degrees to which each state’s engagement is in excess of or is equal to (represented in green), or falls short of (represented in red) that baseline.
Each state’s engagement has been broken out by week (the first three to have transpired since Crisis Insights’ launch). This allows you to see how engagement has increased, decreased, or held steady week-to-week.
The data used for Crisis Insights’ reporting is collected and analyzed daily, and then reported to subscribers as rolling seven and 30-day averages (as well as a full data series).
In addition to the insights shared here — regarding where each state’s residents stand when it comes to engagement with topics surrounding the COVID-19 matter — this also offers a small glimpse into how our constantly revised, amended, and well-presented reporting allows brands to observe, compare, and retain context for customer behaviors, concerns, affinities, etc., as they shift, change, and are even replaced over the coming weeks and months.
Massachusetts is the top ranked state here, with its citizens’ engagement with online COVID-19 coverage exceeding the baseline by 1.41 times. The state’s week of highest engagement, to date, has been the week of March 22 to March 28. The week of March 29 to April 4 has, thus far, seen the lowest engagement from the state’s residents.
As of this writing, the state has been home to the third highest number of diagnosed cases, and the fifth highest number of confirmed deaths from the virus.
At the other end of the spectrum is Mississippi, which has thus far seen the 28th highest number of diagnosed cases. It has experienced the 26th highest number of confirmed fatalities resulting from the virus.
The state’s week of lowest engagement, to date, has been the week of March 22 to March 28. The week of March 29 to April 4 has, thus far, seen the greatest engagement from the state’s residents.
Finally, for now, of very real note is the upward trend in engagement detectable among many states currently found in lower half (mid-30s to high-40s). Kansas, Iowa, Wisconsin, Kentucky, the Dakotas, Utah, West Virginia, and Arkansas have all found their residents engaging with COVID-19 content to an increasing extent.
We eagerly invite you to visit our Crisis Insights page here, and to reach out to us to learn a great deal more about the service, and to check out a demo.
As before, and as always, we sincerely hope that all reading are doing as well as circumstances allow, and are safe.
What are Crisis Insights?
Crisis Insights provides subscribers with near real-time updates on how the unprecedented climate in which we all find ourselves is affecting consumer sentiment, both among the general public, as well as a brand’s specific customers.
Changes in consumer sentiment are tracked in this reporting, for 32 crisis-related segments, across four general categories:
People concerned about the Covid-19 epidemic
People concerned about the direction of the economy
People coping and adjusting to the ‘new normal’ environment
General attitudes and psychographic outlook of the population.
We encourage you to visit these previously shared Crisis Insights related posts:
We took a look at the personalities of those most actively engaged with COVID-19 content online:
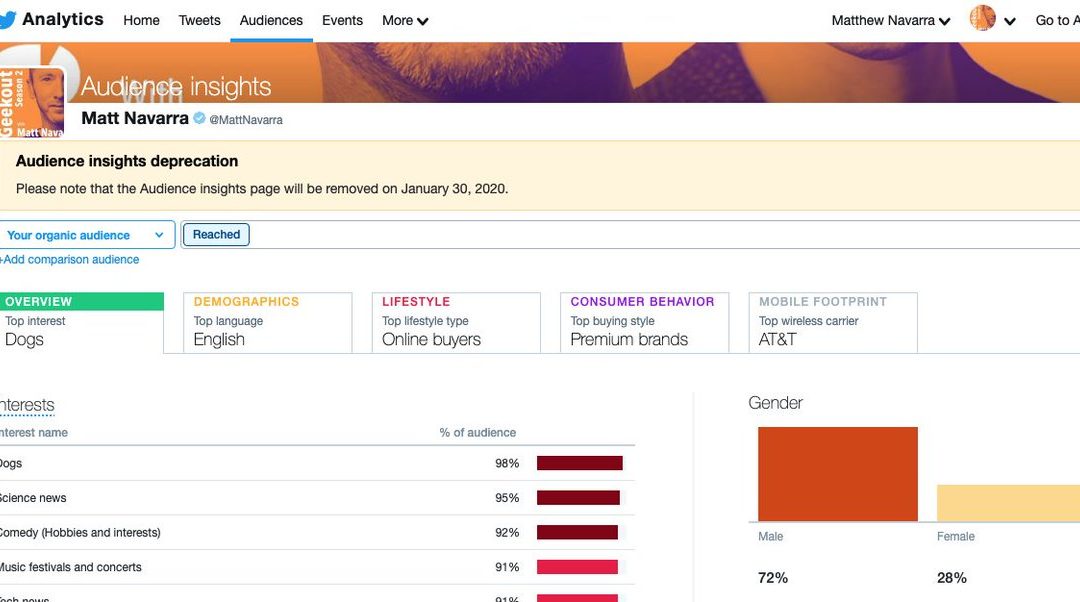
Twitter discontinued its Audience Insights from Twitter Analytics in January 2020. Introduced in 2015, Twitter’s Audience Insights provided in-depth data/insights about Twitter followers and those who engaged with tweets. Insights included demographic information, purchase behavior, interests and lifestyles. By revealing insights about followers, the data helped marketers and other users improve their Twitter strategy, including both nonpaid and advertising.
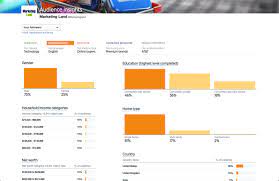
Thankfully, StatSocial offers a comprehensive alternative to Twitter Audience Insights that includes all of the features users knew and loved, plus a lot more.
StatSocial Audience Insights
StatSocial’s data and insights enable marketers, planners, and media sellers to identify and reach the best consumer prospects and measure marketing campaign effectiveness by leveraging uniquely social audience insights. StatSocial’s technology is built on a taxonomy of over 85,000 attributes (demographics, brand affinities, interests, media properties, influencers, and IBM Watson Personality Insights).
For Twitter followers, personas, or even first party data, StatSocial’s alternative to Twitter Audience Insights can uncover key insights around the four following types of data:
1. Earned Engagement – With the rise of earned media comes the need to measure and target the customers and prospects that are engaging with influencers, blogs and earned media content. StatSocial identifies people who are organically seeking out and engaging with your brand, topics, or your competition across different media.
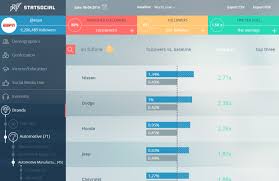
2. Influencer Audiences – StatSocial builds audiences and insights by identifying what content resonates with an influencer’s network. Influencer audiences allow you to market directly to prospects that overlap with any industry, trend, and or brand – with results that far exceed typical interest-based behavioral targeting
3. IBM Watson Personality Insights – StatSocial has partnered with IBM Watson to bring the power of Personality Insights™ cognitive computing to the marketing landscape. By working together to analyze billions of social media and blog posts, StatSocial and IBM Watson help marketers understand the specific motivations of their best consumers and prospects so they can plan content andreach the most receptive consumers.
4. StatSocial Digital Tribes – Our data scientists modeled the entire US population into 100 unique clusters, or “Digital Tribes.” Using billions of inputs from over 120M US consumers, we segmented naturally occurring groups across distinct demographics, personality traits and passions. For those familiar with traditional cluster models such as PRIZM, Personicx, Mosaic, and Tapestry, we believe this layer of social behaviors and personality traits, which only StatSocial can offer, provides the richest possible insights into what motivates different types of people to action.
For first time visitors: What we do here at StatSocial is analyze social media audiences. That means any grouping of individuals you could imagine coming together in a social media context. From a specific company’s or individual’s fans, to those tweeting of a certain topic or employing a certain hashtag, to any conceivable, identifiable grouping that could occur in a social media context.
We scour every corner of the social web to learn as much as humanly possible about the folks in that group. We know who they are, how old they are and in what percentages, we know from where they are, we know what they like and dislike, what they do on the web, what brands they prefer, and so forth. If social media is in any way a part of your marketing plan — and in 2016, let’s face it, it is — then the value in the data we provide we believe is pretty evident.
You can learn more here, and check out some sample reports here.
If you have any further questions please feel free to reach out to us on Twitter.
We use cookies on our website to give you the most relevant experience by remembering your preferences and repeat visits. By clicking “Accept All”, you consent to the use of ALL the cookies. However, you may visit "Cookie Settings" to provide a controlled consent.
This website uses cookies to improve your experience while you navigate through the website. Out of these, the cookies that are categorized as necessary are stored on your browser as they are essential for the working of basic functionalities of the website. We also use third-party cookies that help us analyze and understand how you use this website. These cookies will be stored in your browser only with your consent. You also have the option to opt-out of these cookies. But opting out of some of these cookies may affect your browsing experience.
Necessary cookies are absolutely essential for the website to function properly. These cookies ensure basic functionalities and security features of the website, anonymously.
Cookie
Duration
Description
cookielawinfo-checkbox-analytics
11 months
This cookie is set by GDPR Cookie Consent plugin. The cookie is used to store the user consent for the cookies in the category "Analytics".
cookielawinfo-checkbox-functional
11 months
The cookie is set by GDPR cookie consent to record the user consent for the cookies in the category "Functional".
cookielawinfo-checkbox-necessary
11 months
This cookie is set by GDPR Cookie Consent plugin. The cookies is used to store the user consent for the cookies in the category "Necessary".
cookielawinfo-checkbox-others
11 months
This cookie is set by GDPR Cookie Consent plugin. The cookie is used to store the user consent for the cookies in the category "Other.
cookielawinfo-checkbox-performance
11 months
This cookie is set by GDPR Cookie Consent plugin. The cookie is used to store the user consent for the cookies in the category "Performance".
viewed_cookie_policy
11 months
The cookie is set by the GDPR Cookie Consent plugin and is used to store whether or not user has consented to the use of cookies. It does not store any personal data.
Functional cookies help to perform certain functionalities like sharing the content of the website on social media platforms, collect feedbacks, and other third-party features.
Performance cookies are used to understand and analyze the key performance indexes of the website which helps in delivering a better user experience for the visitors.
Analytical cookies are used to understand how visitors interact with the website. These cookies help provide information on metrics the number of visitors, bounce rate, traffic source, etc.
Advertisement cookies are used to provide visitors with relevant ads and marketing campaigns. These cookies track visitors across websites and collect information to provide customized ads.