For this study, StatSocial executed a side-by-side-by-side analysis of the three giants of the Platform-as-a-Service/Infrastructure-as-a-Service sector: Microsoft Azure, Amazon Web Services, and Google Cloud Platform.
By analyzing the data generated by the most dedicated users of the three platforms, we can ascertain where each service’s customers’ priorities reside, and in turn where each is strongest. In this hyper-aggressive space — where these three tech behemoths are vying to be the definitive market leader, and with the needs for these services only increasing for the foreseeable future — these insights could be the key to having the competitive edge.
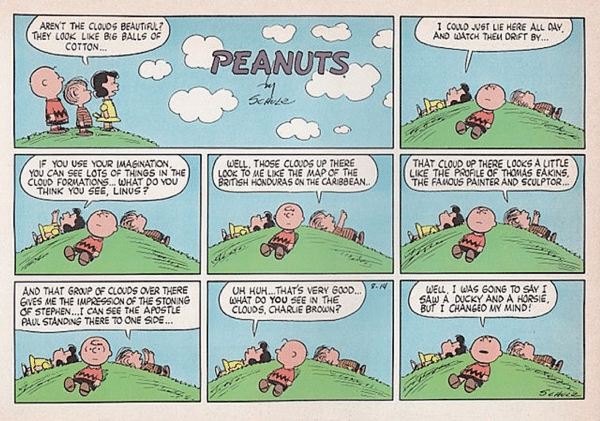
When gazing up at the skies on a beautiful summer’s day, the shape of the clouds will recall for different people any number of things. Maybe a puppy, or perhaps — as is the case for Linus in the comic strip featured here — the stoning of St. Stephen.
There is an objective truth about what clouds are, though; water droplets and ice crystals formed when the temperature of rising air cools below the dew point.
There is an objective truth about the clouds upon which we’ll be gazing in this entry as well. By now, you probably know the meme…
While we’re left to assume that the bit about the dew point is failing to grasp the nuance, or even the poetry, of the thing, so too is the description in the above graphic desperately wanting. Certainly, at least, if we’re discussing cloud computing’s three biggest names: Microsoft Azure, Amazon Web Services, and Google Cloud Platform.
A Quick Summary of the Market
Amazon Web Services
As of this writing, Amazon leads this sector somewhat confidently. A Synergy Research Group study from 2018 reported that AWS’ market share has held steady at around 33% for 12 consecutive quarters.
AWS’ growth has continued in keeping with the cloud computing sector itself, even as said sector has tripled in size in recent years.
Microsoft Azure
Comparable newcomer (at least relative to Amazon’s over ten years in the game), Microsoft Azure, has been coming up the rear, and quickly. With the vast majority of American businesses running on Microsoft software, they entered the market with a strong calling card.
Microsoft’s virtual machines are not strictly for Windows parties, however. They also support Linux, Oracle, IBM, SAP, and so on.
One perk of Azure that is oft cited is an eagerness to cater to enterprises seeking a “hybrid cloud” solution. For many companies, handing over all data and infrastructure to a public cloud — and its accompanying support — is not wise, and is often not an option. Retaining some on-premises systems is crucial for many enterprises for reasons ranging from scalability to security, and beyond.
Azure boasts support that is prepared to integrate, and cooperate, with a company’s own data center. The size of AWS being what it is, accommodating hybrid systems is not a priority, and thus far it hasn’t had to be.
Google Cloud
Google’s entry into this area, late-arriving though it may be, has thus far found them growing quickly into their third place slot. The services they currently have on offer are not as robust and extensive as the two platforms addressed above, but what they do they do excellently, and rather affordably. Google has, to this point, not been so focused on catering specifically to enterprise demand, instead providing ground-up computing solutions for customers with needs of quite varied sizes. They do this, also, bringing to the table Google’s engineering expertise, as well as their substantial AI, analytics, and machine learning capabilities.
On Earned/Social Audience Data
A bit of an explanation of what the comparisons in this entry are about, and how we calculated them.
StatSocial’s data is culled from the earned engagement data (e.g. what people read, like, follow, share, talk about, etc.) of over 300 million consumers. Our analysis of all the content people engage with creates over 80,000 unique attributes per consumer. As a result, we provide an in-depth breakdown of an audience’s interests, affinities, media preferences, hobbies, allegiances, to which of our Digital Tribes they belong, and thanks to our partnership with IBM Watson™ and the integration of their Personality Insights™ service into our analysis, even personality types.
Our reporting reveals things that could not feasibly be learned through hundreds or, truthfully, hundreds of thousands of surveys and focus groups. StatSocial peers beyond the manicured and curated identities of social media, and digs into what really makes the various segments of any given audience tick.
While what you’ll find below may seem like a lot of data, it is only the tip of the iceberg of the insights StatSocial has on offer, regarding these (and all other) audiences. That said, we’re experts at tailoring the analysis to our users’ needs, so they’re never overwhelmed by the data.
An Explanation of the Insights Below:
The insights below are mostly sorted according to our index score. The score shows the degree to which the corresponding demographics, behaviors, and/or affinities being reported either exceed, are in line with, or fall short of the baseline. For this study, the baseline we’re using is the average American social media audience.
— — — —
DEMOGRAPHICS
The best place to start is usually at the beginning, and that’s just about where we are here.
Let’s get to know these groups of dedicated customers, first, by digging into some of the basic, fundamental stats behind each.
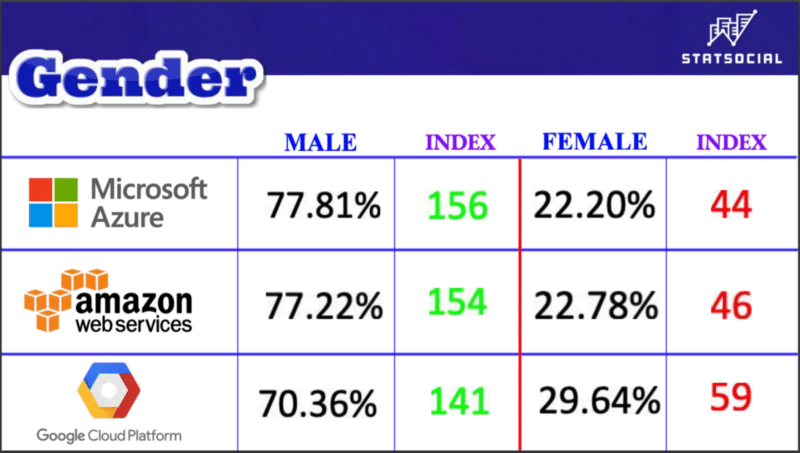
EXPLANATION: The percentages represent the actual percentage of each audience listed above that accounts for the corresponding column header. The index score reflects the degree to which that percentage is in excess of, is in line with, or falls short of our baseline (here, the average American social media audience). So, 77.81% of Microsoft Azure’s audience is male. This exceeds the baseline by 1.56 times.
Google Cloud’s female customer-base is proportionally a fair bit larger than that of the other two platforms. All are clearly majority male, but with these being the numbers, Google does seem to be attracting more clients with women in developer, infrastructure, and database management roles.
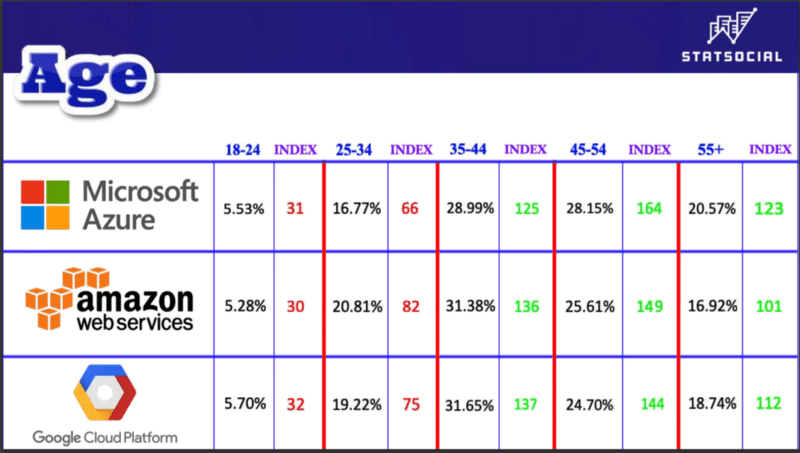
In keeping with what is explained in the caption to the previous graphic, 28.15% of Microsoft Azure’s customers are between ages 45 and 54. This percentage over-indexes our baseline by 1.64 times.
All three of these groups skew comfortably older than the average American online audience. Microsoft Azure’s customers are the most seasoned out of this bunch, with those over age 55 exceeding the baseline by nearly 1 ¼ times.
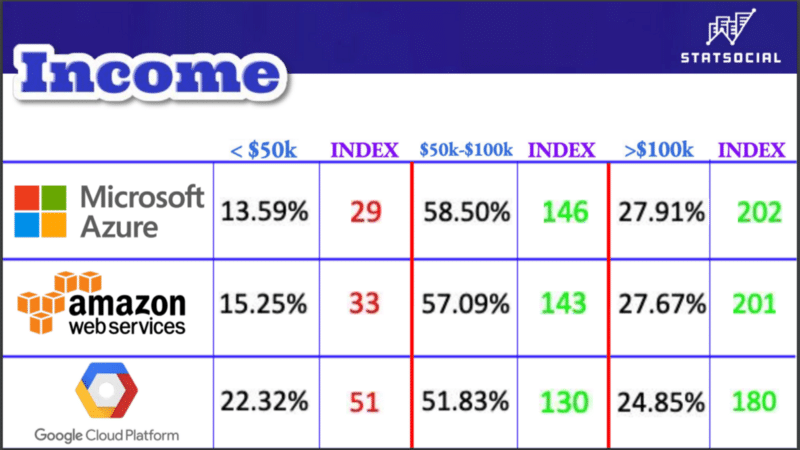
Again, consistent with the explanations captioning the two graphics prior to this, 27.91% of Microsoft Azure’s customers earn $100k a year or more. This quantity over-indexes our baseline by 2.02 times.
As with many StatSocial insights, a question raised by one statistic will be answered or given context by another. Even lacking that clarity here, however, it can be observed that when the lowest earning of the audiences being examined contains a nearly 77% segment earning $50k a year or more, you are looking at a bunch of well-paid audiences.
— — — —
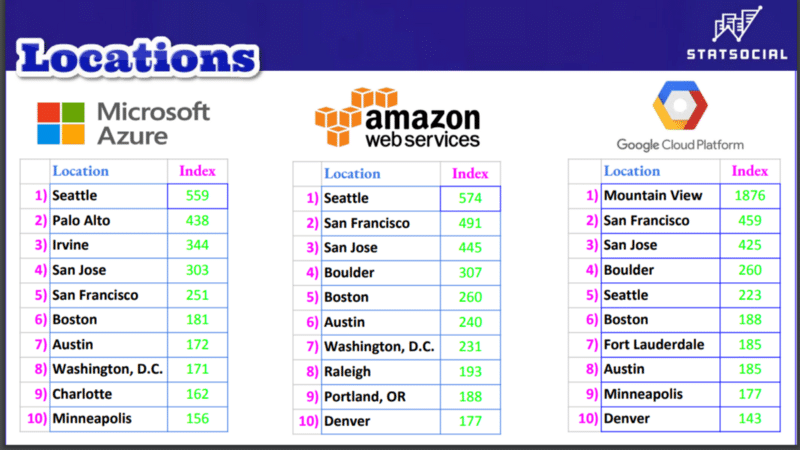
LOCATIONS
Given that the largest number of clients for these services will be centered in a handful of cities above all others, this seemed a set of data worth including.
First, the basic numbers.
Microsoft Azure customers who reside in San Jose exceed the quantity found among the average American social media audience by 5.59 times. The portion of Google Cloud Platform customers who reside in Minneapolis over-index the baseline by 1.77 times.
The northwestern tech-hubs you’d expect are accounted for, as are those cities that are more peculiar to one of the companies over the others.
Any city that Amazon Web Services’ customers call home in large numbers, also finds Amazon’s audience as the most over-indexed of the three being looked at. This is, perhaps, most noteworthy in the case of Seattle, a town that genuinely is what it is today, to a decent degree, because of Microsoft. Fear not, though, things even out as we progress.
— — — —
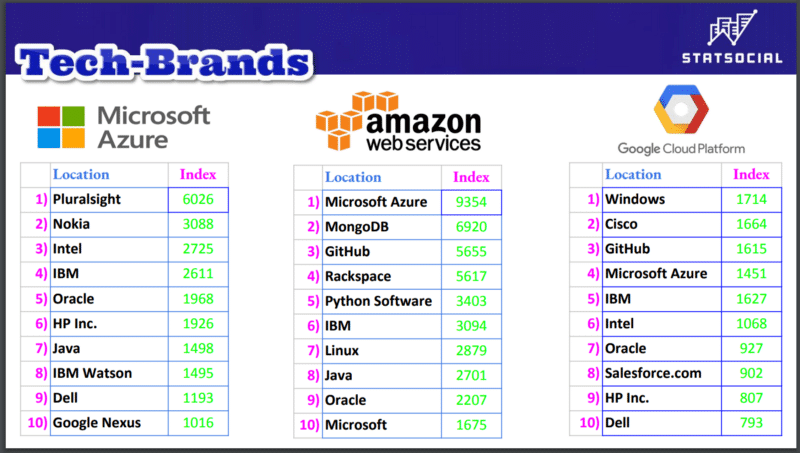
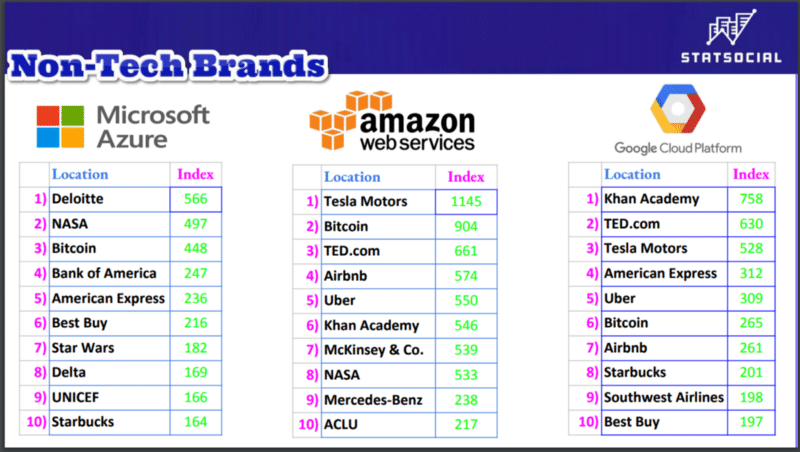
BRANDS
The extent to which tech-brands — manufacturers of computers, mobile devices, softwares, and providers of things such as, oh, say, cloud computing services — dominated these lists made it seem a wise and fair idea to include a second batch. The non-tech brands deserve their moments in the sun, do they not?
A vital thing to note about StatSocial is that, when going through our reporting, you can home in on a specific set of statistics, getting as granular as you please, or look at a more broad data-set (like, say, “brands” in general).
Let’s start with those tech brands.
As all the preceding graphics’ captions have hopefully made clear by now, Microsoft Azure’s customers are also interested in Nokia to a degree that exceeds what you’d find among the average U.S. social media audience by 30.88 times.
Each platform was the number one brand with its own customers. As you’d expect. So, the number ones listed above are actually the number twos. But would you look at who’s atop the list of brands most popular with Amazon Web Services’ most dedicated customers? Microsoft Azure; also the number four brand among Google’s customers.
While the below lists have rather techie non-tech brands upon them, we believe where and how we made the distinctions should be rather clear.
— — — —
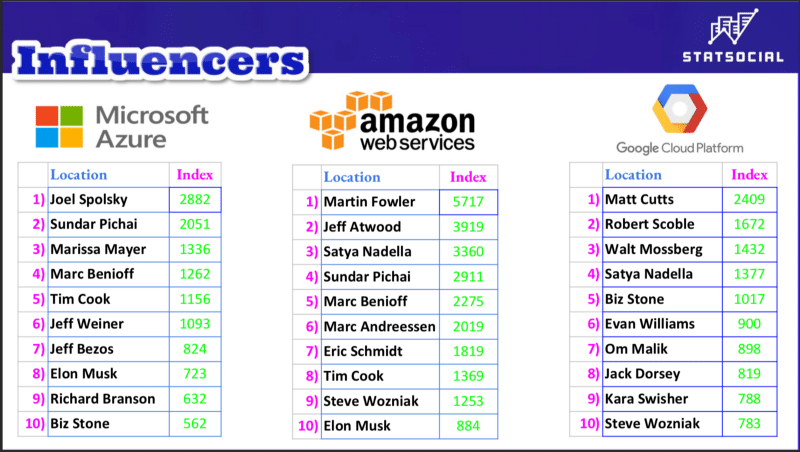
INFLUENCERS
None of us are raised in a vacuum. Wouldn’t we suffocate?
They like the influencers listed below, though, and they pay attention to them. Also, a narrative established virtually from word “go” of this study is now confirmed beyond doubt, these gatherings of devoted customers are way into tech stuff.
— — — —
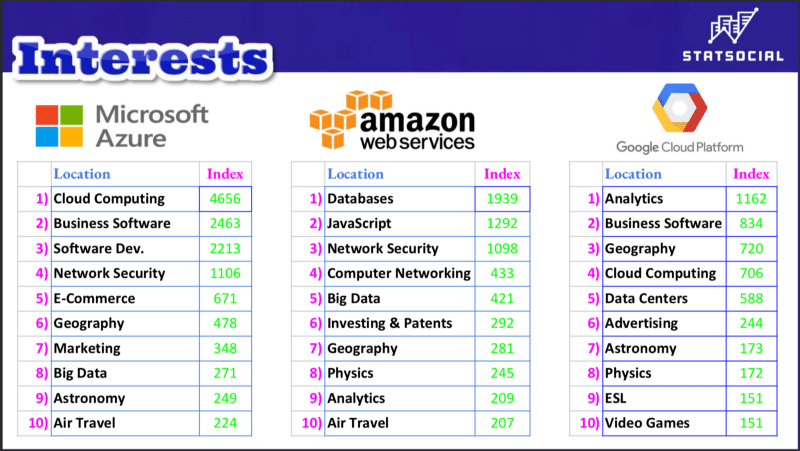
INTERESTS
While few are bereft of influence, virtually no one is entirely disinterested in all things.
The combination of interests below takes things to places that might not be entirely expected (geography, for example, which is useful, incidentally, if you’re taking things to places). But, you’ve got to confess, the below lists don’t precisely buck expectation. They do, however, illustrate that the StatSocial instruments are calibrated correctly.
We also, incidentally, can promise you that as you descend any one of these lists, more and more surprises will emerge. Hit us up for a demo, and learn precisely what types of surprises…
But wait, we’re not quite there yet.
— — — —
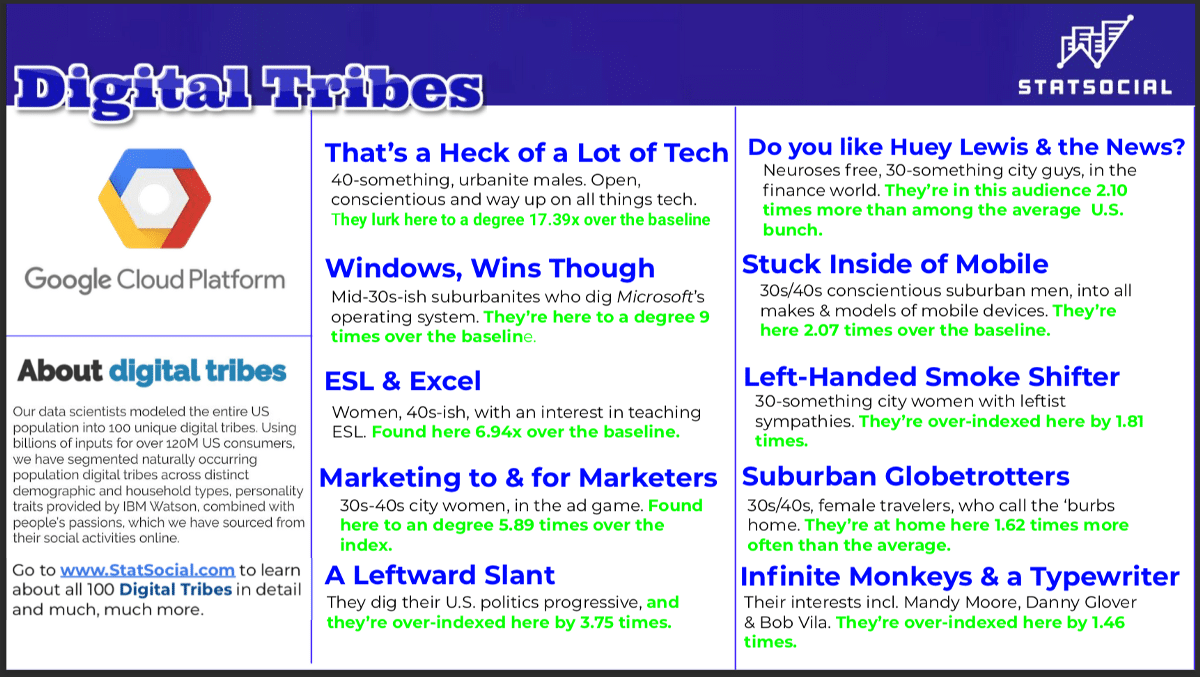
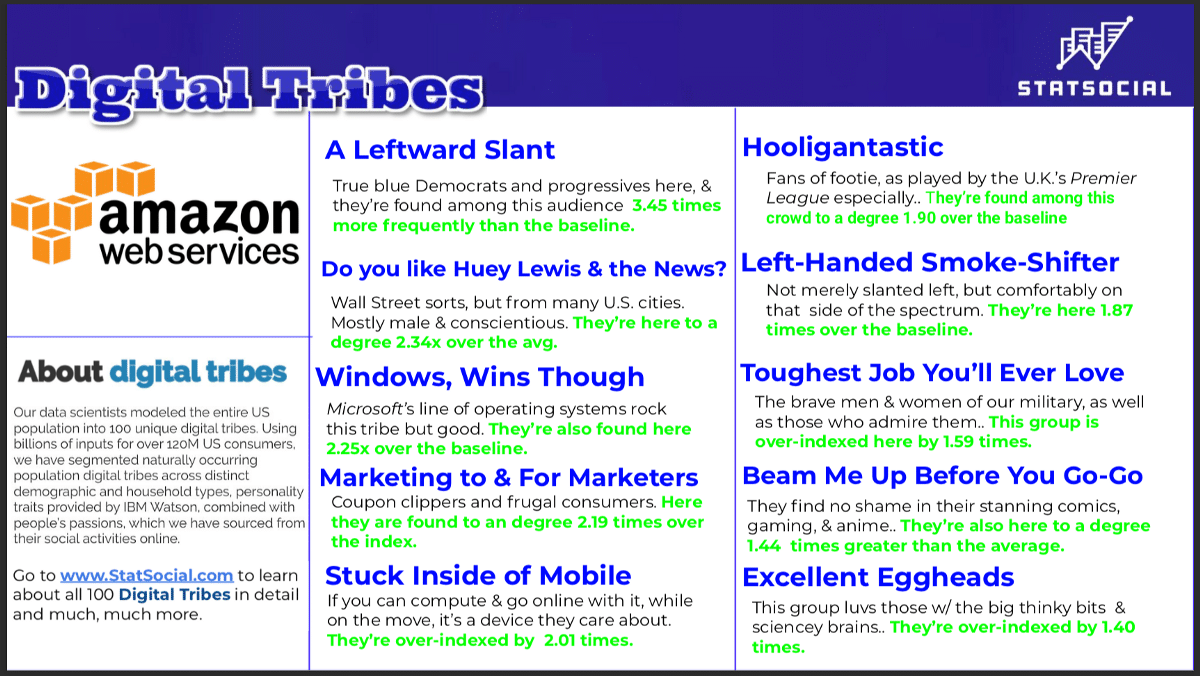
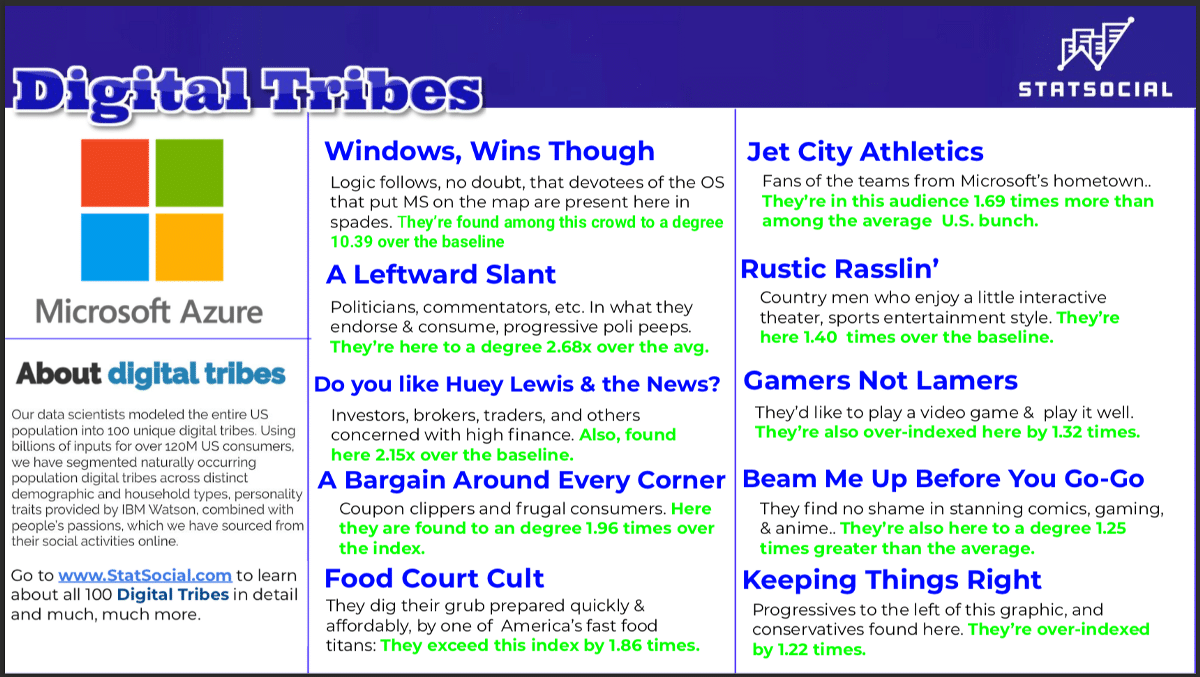
DIGITAL TRIBES
You can read a blog entry detailing this very special set of data by clicking this link, but we’ll also summarize things here.
StatSocial Digital Tribes is a model of the U.S. population broken down into 100 distinct market segments. Seeing which Tribes are present, and in what proportions, grants our users quick, crucial, and unprecedented insight into the humans who make up a given audience.
Combining our demographic and affinity data, with our Personality Insights® (powered by IBM Watson), we have been able to gather these utterly singular segmentation models. Both sides of the data coin are factored in — the demographic and the psychographic — enabling StatSocial to provide brands, publishers, media buyers, and agencies a comprehensive, in-depth understanding of their target audiences.
The three graphics below show the 10 best represented Tribes among each of the audiences being explored here. An ever-so-brief summary of the shared affinities, demographics, and/or personalities of each tribe is then provided.
More in-depth descriptions of each Tribe referenced below, and the remainder of our 100 Digital Tribes can be seen by clicking here.
Among the great many things StatSocial will tell you about any audience, one of the most distinctive, revealing, and essential, is a breakdown of the various personality types to be found among any audience being explored.
Thanks to StatSocial’s proud partnership with IBM Watson™ and the integration of their Personality Insights™ service into our reporting we can report on 52 unique personality traits with as much confidence as we do those metrics which to some might seem more concrete.
The broad conclusions are clear, but some more specific stories are told as well. Amazon is the war horse. The current king of the mountain. Microsoft seems to be an increasingly popular choice among those making the increasingly popular decision to pursue a hybrid cloud computing solution for their business.
Google is also growing rapidly, and is providing services a bit distinct from their two biggest competitors.
There’s a great deal more to be learned here, though (or perhaps you’d prefer to learn something directly related to another industry in which you work). Reach out to StatSocial and we’ll gladly talk to you about it.
Insights on top of insights can be found by the curious reader who chooses to poke around the StatSocial blog here. Peruse the many entries, offering all kinds of insights, studies, and deep dives to better acquaint you with the capabilities of StatSocial.
Throughout the blog are many examples of the sorts of insights that can only be gained with StatSocial.
We’ve been using this blog as a space for highlighting insights generated by StatSocial’s new Crisis Insights service.
Built on StatSocial’s Silhouette™ social data platform, the service has been devised as a tool for brands, marketers, and agencies seeking to understand the rapidly changing dynamics of their customers who, as a result of the uncertainty born of the COVID-19 pandemic, are finding their own perspectives, concerns, and needs shifting daily.
Silhouette™ monitors and analyzes more than 1.3 billion social accounts, encompassing more than 70% of U.S. households. It is the only platform that tracks and segments social audiences at such a scale.
Crisis Insights tracks all changes in consumer sentiment, relating to 32 brand-new insight segments — all formed in the wake of the epidemic — across four general categories:
People concerned about the Covid-19 epidemic
People concerned about the direction of the economy
People coping with, and adjusting to, the ‘new normal’ environment
General attitudes among, and the psychographic outlook of, the population.
In this entry, we will be focused on the first and fourth categories.
Thanks to our partnership with IBM Watson™ and our integration of their powerful Personality Insights tool into our reporting, we can tell you not just who the people are who make up a given audience, but how they are.
Using linguistic analysis, Personality Insights™ scours all digital communications generated by the members of an audience being analyzed by StatSocial, including email, blogs, tweets, and forum posts. From there an incredibly accurate personality profile of that audience is created.
When categorizing personalities, Personality Insights™ uses for its top tier, the Big Five personality traits, a widely adopted taxonomy in the psychological community.
Those traits are, Openness, Conscientiousness, Extraversion, Agreeableness, and Neuroticism. Each of the big five can get more granular in their descriptions, with each holding under its umbrella a number of sub-categories.
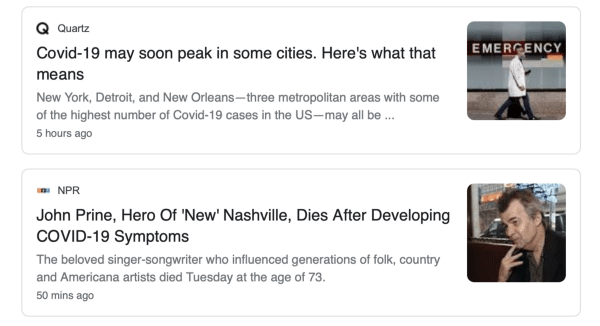
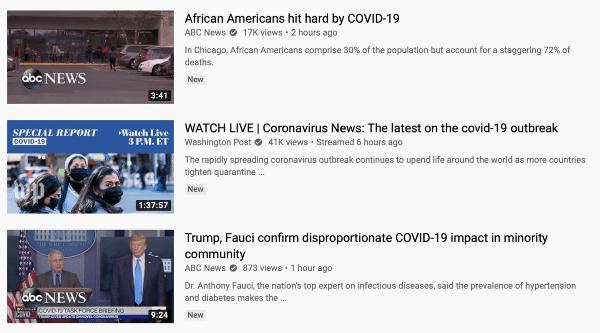
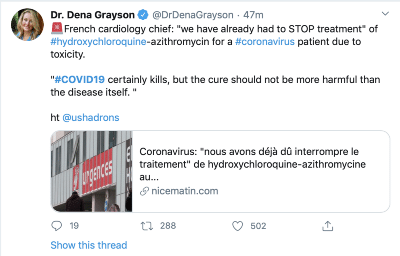
StatSocial is analyzing people engaging with all the latest Covid-19 news
With that, we present…
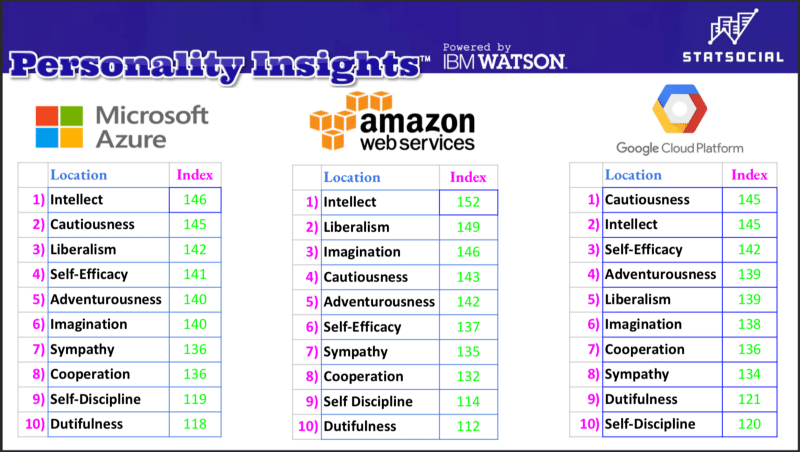
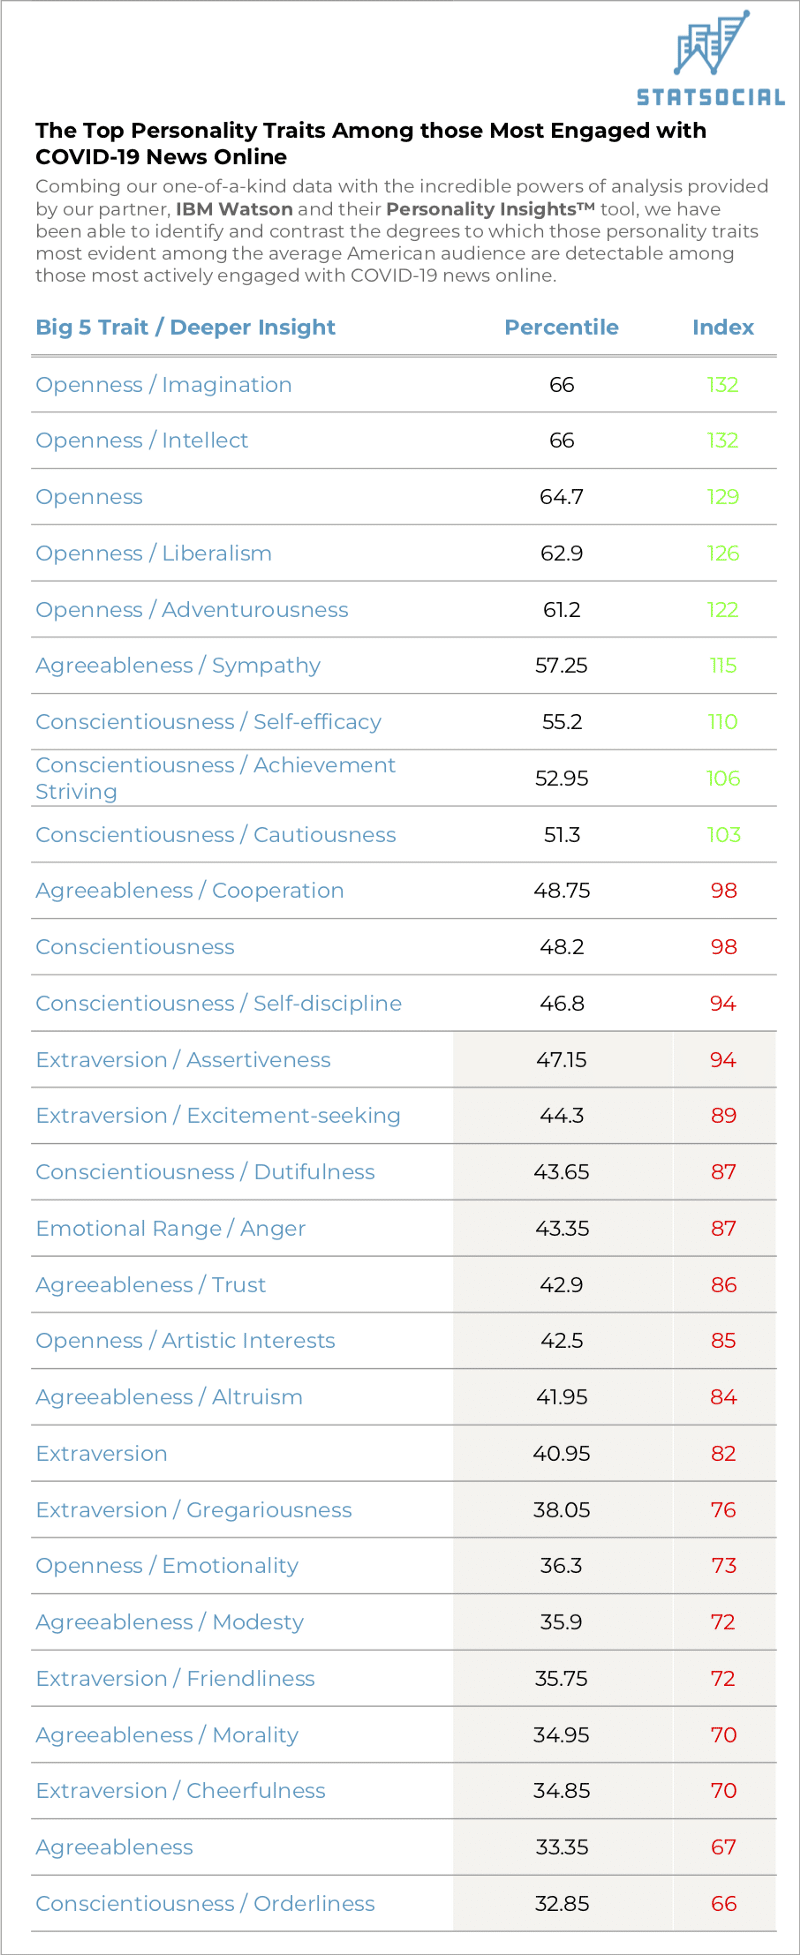
The Top Personality Traits Among those Most Engaged with COVID-19 News Online
Explanation of the below data: The Percentile column shows where this audience (those most engaged with online news relating to COVID-19) ranks among the greater U.S. population when it comes to possessing the corresponding personality trait.
The Index score quantifies where this result falls in relation to the average. 50th percentile is the average, and an Index score of 100 also reflects average. So, an index score of 125 would mean the corresponding percentile exceeds the average by 0.25 (or ¼).
Those Index scores that exceed the average will be shown in green, and those falling short will be shown in red.
The most immediately apparent observation is that, of the Big Five, Openness is powerfully evident here. We see that of the many traits that fall under the Openness header, Imagination and Intellect outrank them all. Indeed, those traits are comfortably evident here to a degree that exceeds the U.S. average.
Liberalism, in this context, does not necessarily mean what many may think at first glance. It is not a political designation. Personality Insights™ defines liberalism as “a readiness to challenge authority, convention, and traditional values.” And here, it also ranks highly, as does Adventurousness.
On the other end of the spectrum, some traits that can be found in abundance among the average American audience are not all that detectable here.
Agreeableness, which describes “a person’s tendency to be compassionate and cooperative toward others,” according to IBM, is measurable here to a degree falling well below the average.
Conscientiousness relates to “a person’s tendency to act in an organized or thoughtful way.” Orderliness is a natural sub-category of that, relating to the degree to which people are “well-organized, tidy, and neat.” At this moment in time, those most engaged with online reporting about the COVID-19 epidemic are coming up well below the average in this regard.
These personality traits, as well as the Needs and Values that we share, when taken in the context of Crisis Insights — and its almost real-time measuring of changing sentiments — are a crucial gauge of the public mood, outlook, and spirit.
This demonstration also illustrates one of the many ways our reporting can be can be used to compare and contrast the sentiment detectable among a greater audience with that of a more specific one.
We again eagerly invite you to visit Crisis Insights, and reach out to us to learn a great deal more about the service, and to check out a demo.
As always, we deeply hope that all reading are well and safe, and are getting through this all to the very best of your abilities.
We encourage you to visit these previously shared Crisis Insights related posts:
Here we examine the preferred TV genres of those most active in the online COVID-19 discussion:
Today, we’re focusing on one of the streaming audio industry’s leaders, Spotify, and a promotional perk they’ve offered this month to those who subscribe to their commercial-free, paid premium service. This year’s end/decade’s end treat is called #SpotifyWrapped, and it is really awesome.
The #SpotifyWrapped feature provides users with a number of fun and beautiful charts and graphs, detailing favorite songs and album titles, artist names, podcasts, and all related numbers. In short, each Spotify customer is given a personalized story of their year and/or decade in listening. Hundreds of thousands of people have been sharing their stories across social media, blogs, and forums.
StatSocial is here to shine a light on the Spotify customers who have taken to #SpotifyWrapped— in demographics, media affinities, favorite influencers, brands, hobbies, personality traits, and Digital Tribe associations — not only comparing them to the average consumer, but also to the average Spotify customer as well.
Let’s dig in.
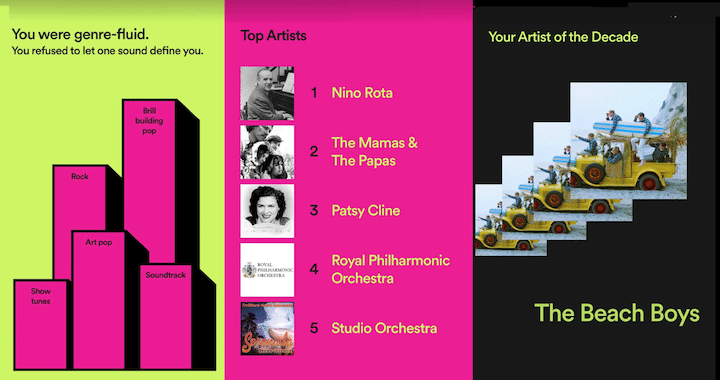
The musical acts for whom the hundreds and hundreds of thousands who came online these past two weeks to post about #SpotifyWrapped display the strongest passions. Up front, L-R: Brendon Urie (of Panic! At The Disco), Joji, Post Malone, Kim Petras, one half of Twenty One Pilots, Halsey, the other half of Twenty One Pilots, cupcakKe. And in the back, L-R: Billie Eilish and Rich Brian. Not pictured: NCT (there are just too many of them).Some 2019 #SpotifyWrapped results for StatSocial Founder & President, Michael Hussey.
A BIT ABOUT WHAT WE DO
The data StatSocial utilizes for our insights is sourced from the earned engagement (meaning, what people read, like, follow, share, and talk about online) of over 300 million consumers. The analysis of all the content people engage with — which is made available in every StatSocial report — creates over 85,000 unique attributes per consumer.
Our analysis can be applied to virtually any sort of online audience you can imagine, from the customers of a certain brand, to the fans of a specific performer, or — as is the case here — those posting about a certain topic, or using a specific hashtag (or hashtags), or anything else you can imagine.
TO ILLUSTRATE
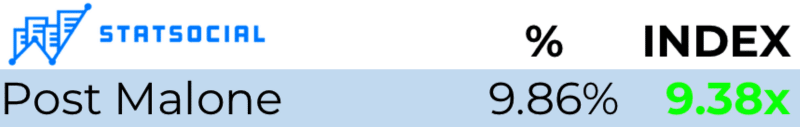
Here’s a quick guide to reading the numerous charts you’ll find in this entry.
The below example indicates that 9.86% of those who posted online using the #SpotifyWrapped hashtag are fans of Post Malone. This exceeds the percentage of Post Malone fans within the average American online audience by 9.38 times. This, of course, means that right now about 1.05% of the average American online audience identifies as fans of Post Malone.
— — — — — — — — — — — — — —
So, enough of the gab. Let’s get to the stats.
#SPOTIFYWRAPPED DEMOGRAPHICS
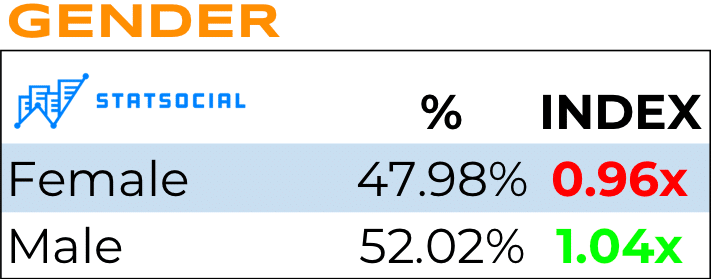
EXPLANATION: The index score quantifies, at-a-glance, the degree to which the corresponding percentage is in line with, exceeds, or falls short of the baseline. For example: 52% of those posting about #SpotifyWrapped are males. This exceeds the degree to which males can be found within the average American online audience by 1.04 times.
Things here skew slightly, but not dramatically, male. Commenting on this would be premature, as it’s quite likely that with such a close-to-even split, we may not find this overwhelmingly relevant to what we’ll be exploring below.
But who knows yet? Let’s keep going and see.
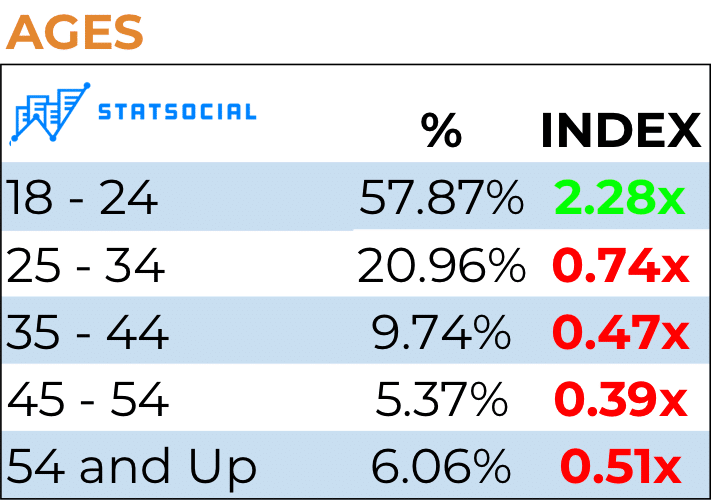
EXPLANATION: The index score quantifies, at-a-glance, the degree to which the corresponding percentage is in line with, exceeds, or falls short of the baseline. For example: 57.87% of those posting about #SpotifyWrapped are between ages 18 and 24. This exceeds the degree to which males can be found within the average American online audience by 2.28 times.
Now here is a set of statistics that are very likely to be relevant to the insights we’ll be providing below. Nearly 58% of the #SpotifyWrapped audience are between ages 18 and 24, a segment-size that exceeds that which would be found among the average American online audience by 2.28 times.
With 78% of the audience being either Millennials or Zoomers — demographics that (as an aside) are oh-so desirable to marketers, natch — we expect to see the preferences explored below reflecting this.
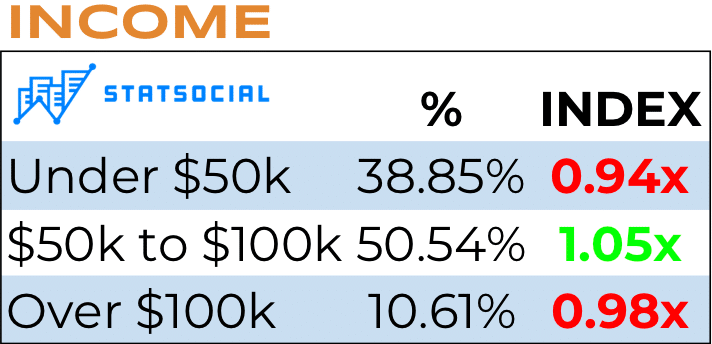
A somewhat surprising result for such a young audience. Of course, all of these figures could be argued to be more-or-less statistically in line with our baseline, meaning #SpotifyWrapped is popular with consumers at all income levels.
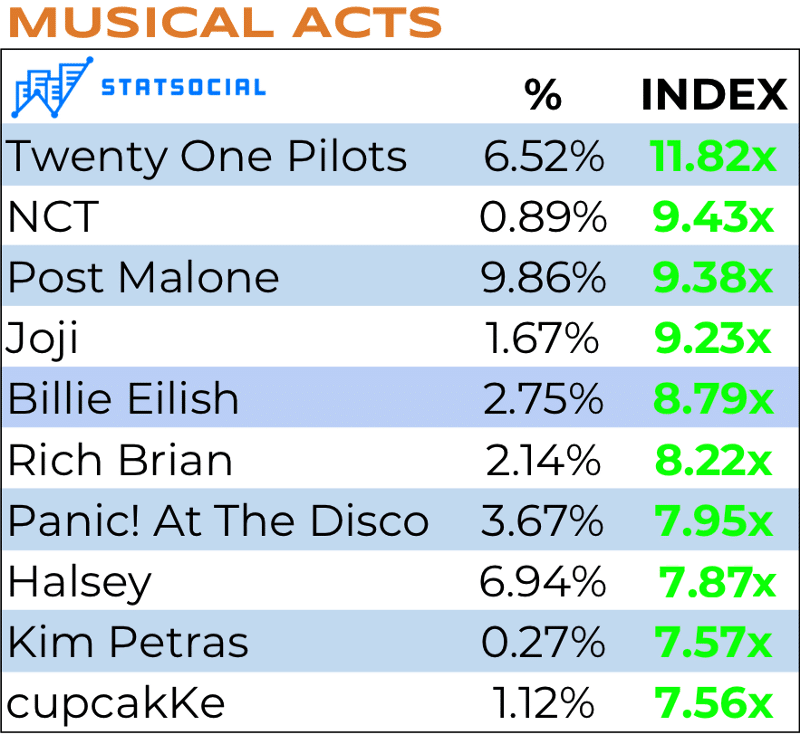
#SPOTIFYWRAPPED FAVORITE MUSICAL ACTS
Let’s get things started with what all of this is truly about, shall we?
EXPLANATION: The index score quantifies the degree to which the corresponding percentage is in line with, exceeds or falls short of the baseline or average. For example, 2.14% of the #SpotifyWrapped audience identifies as fans of Rich Brian. This segment-size exceeds what you’d find among the average American online audience by 8.22 times.
Fans all over this fine planet took to Spotify this year to stream the music of one Mr. Post Malone; a man who seems so legitimately friendly and likable, he most certainly has more than done his part to change the narrative on facial tattoos.
During 2019, Mr. Malone’s music was streamed on the platform over 6.5 billion times. While he most certainly finds love among this #SpotifyWrapped audience to a degree profoundly exceeding what you’d find within the average American online audience, he has been outstripped in outstripping the baseline.
Billie Eilish (left) and the other half of the act, brother, co-writer, producer, and multi-instrumentalist, Finneas O’Connell (right).
Spotify’s second most streamed artist in 2019, Ms. Billie Eilish — the single artist to whom “the year in pop” can most likely be said to have belonged — finds love among the #SpotifyWrapped crowd to a degree that exceeds the index by a whopping 8.79 times. Yet still, she finds herself in fifth place here.
This audience adores Billie Eilish vastly more so than the average American online audience, and that means quite a lot given how popular the soon-to-be-18-year old superstar is.
There’s been a sizable niche-following for K-pop in the states for a number of years now. The prefab pop acts of Korea’s music industry have been able to tour the states to strong response, particularly in markets that contain a large population of Korean-Americans.
In recent times that changed, and a genre with a passionate, but ultimately “cult,” stateside following has become one of the major concerns of younger listeners across the nation. The biggest boy band of the moment is Korea’s BTS. Formed by Korean company, Big Hit Entertainment in 2013, the group currently dominates the dreams and bedroom walls of young devotees around the globe. Say what you will of Gen Z attention spans, but the group has SEVEN members, and the kids seem to be able to remember them all.
Korea’s idol industry has provided some of that nation’s strongest exports throughout Asia for ages, but the BTS breakthrough seems a harbinger of a full-scale idol invasion to arrive on these shores in massive waves over the coming years.
The act ranking at number two here, with love for them among the #SpotifyWrapped audience being greater than the baseline by 9.43 times, is NCT. The name, no joke, stands for “Neo Culture Technology.” It’s a lot to deal with, we know.
We’ll spare you an in-depth explanation of how many K-Pop idol acts have what is essentially a farm team system. There’s a main act, and then a sort of adjacent junior tier, the members of whom hope to ascend to the A team. But, you can Google all of this yourself, and just chew on the fact that SM Entertainment’s globally beloved NCT is made up of 21 adorable Korean boys with very stylish haircuts. The love these 21 lads find among the #SpotifyWrapped audience exceeds the baseline by 9.43 times.
Rich Brian (left) and Joji (right)
A very different kind of East Asian-centric musical scene is represented above in the form of acts associated with the New York City-based media company, 88rising. Their roster is focused on Asian-American and Asian acts of a full variety of nationalities and ethnicities.
Two of the company’s most immediately recognizable performers are repped above. First, Indonesian rapper and producer, Rich Brian, one of many such artists to initially achieve notoriety through SoundCloud, from where his first single “Dat $tick” really excited listeners. From there he was able to parlay his internet moment into deserved mainstream success. He finds fans here to a degree 8.22 times greater than he does among the average American online audience.
The other 88rising star named above is Joji.
The biography of George “Joji” Miller is far too lengthy to recount here. Raised in Japan, the half-Japanese / half-Australian performer first achieved major fame as the mad mind behind YouTube’s wildly popular Filthy Frank character (and the countless surreal and consciously stupid characters that inhabited his “omniverse”).
Well, he first achieved major fame as the unwitting inventor of 2013’s inescapable “Harlem Shake” meme. But the less said on that, the better.
To the consternation of his dedicated fanbase of literal millions, in 2017 he bid all of that goodbye for good. For some time he’d been posting non-comedic songs to SoundCloud, and eventually his material evolved to where 88Rising made the very wise decision to sign him up.
His sweet singing voice, straightforward lovelorn lyrics, and lo-fi, R&B flavored production make for an appealing combination. His good looks, obscured during his Filthy Frank days, have seemed to do him no harm either.
As of this writing, Joji’s video for his late-2018 single, “Slow Dancing in the Dark” has been viewed on YouTube over 117 million times. Take that, Filthy Frank. Joji fans dwell amongst this audience to a degree 9.22 times beyond the index.
Enough yammering about the list, as you can see it for yourself. Ohio’s Twenty One Pilots — whose 2018 album, ‘Trench,’ was a critical fave — confidently top the list. Affinity for them among this #SpotifyWrapped crowd exceeds the degree to which their fans can be found among the average American online audience by 11.82 times.
LET’S LOOK AT THESE INSIGHTS FROM DIFFERENT ANGLES AND THROUGH DIFFERENT LENSES
All of the above insights were calculated by contrasting the percentages with what you’d find within the average American online audience.
StatSocial allows users, however, to customize the baseline for their studies. Say you’re a marketer who wants to know how the quantity of NBC viewers within your audience compares to those within the audience of a competitor, or perhaps you instead want to compare two competitors (the possible combinations are endless, so we’ll cut this short here), your needs can be easily met.
What about the online audience for Spotify itself? Meaning, the millions online who we identify as users and admirers of the Spotify platform. It makes a lot of sense to contrast the favorite acts of those who posted online using the #SpotifyWrapped hashtag with that audience’s statistics.
Those posting the hashtag seem to be a very definite segment of the greater Spotify audience, and the final results reflect this.
Side-by-side, let’s compare what is probably the most significant difference between the audiences of Spotify, the platform, and those who posted about #SpotifyWrapped.
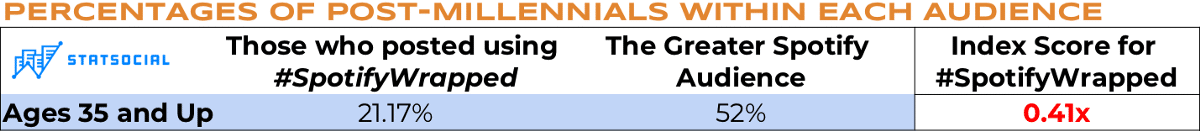
EXPLANATION: 21% of those who posted online using the #SpotifyWrapped hashtag over the past couple of weeks are over 35-years of age. 52% of those within the greater Spotify audience exceed age 35. Using the full Spotify online audience for our baseline, this segment under-indexes dramatically in comparison. Indeed, 0.41 times.
Or looking at these statistics in a possibly more immediately comprehensible way, let’s flip the comparison.
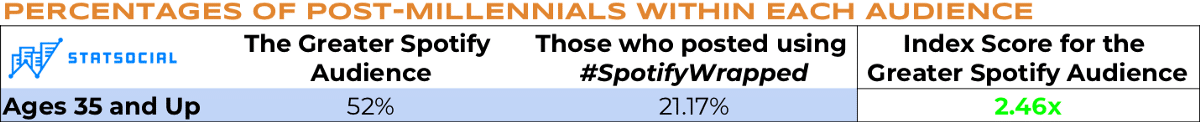
EXPLANATION: 52% of those within the greater Spotify audience exceed age 35. 21% of those who posted online using the #SpotifyWrapped hashtag over the past couple of weeks are over 35. The 35-and-over segment of Spotify’s greater audience exceeds that segment within the #SpotifyWrapped audience by 2.46 times.
A majority of Spotify’s full online audience is over age 35. Here, we’re referring to that as “post-millennial,” but we do realize that your mileage may vary on the matter. Nonetheless, the contrast between this insight and the mere 21% of the #SpotifyWrapped audience exceeding 35-years of age is dramatic.
And with that, using Spotify, the platform’s, audience as our baseline, let’s see which of the #SpotifyWrapped audience’s favorite musical acts contrasted most profoundly.
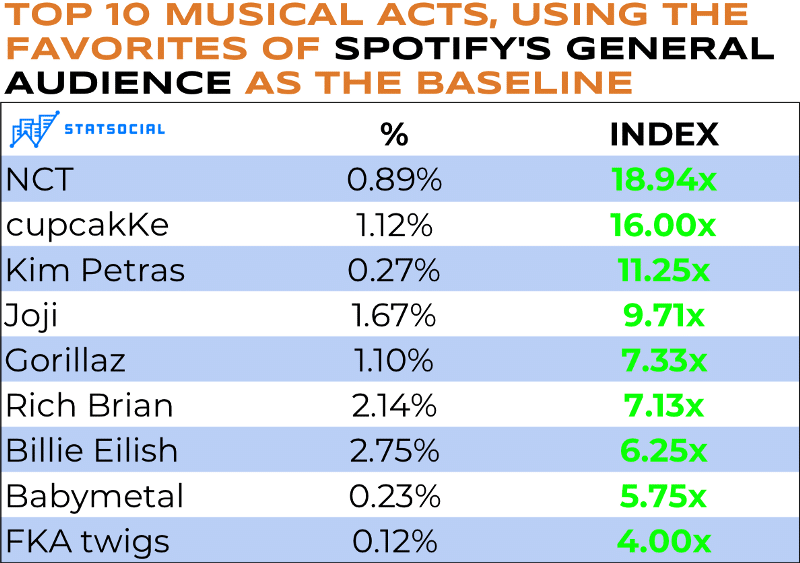
EXPLANATION: The index score quantifies the degree to which the corresponding percentage is in line with, exceeds or falls short of the baseline or average. For this chart, we’re using the online audience for streaming audio platform, Spotify. For example, 1.10% of the #SpotifyWrapped audience identifies as fans Gorillaz. This segment-size exceeds what you’d find among Spotify’s online audience by 7.33 times.
Love for NCT among the #SpotifyWrapped community exceeds the degree to which such love is evident among the general Spotify online audience by a staggering 18.94 times. They over-index against the preferences of Spotify’s general audience to a degree approaching twice what they do with the average American online audience.
The tiny little K-Pop ensemble known as NCT.
The age disparity surely reveals itself in this dramatic over-indexing for a group with, very probably, comparably few fans over age 35.
Kim Petras
More surprising are the substantial degrees to which cupcakKe and Kim Petras’ popularity among the #SpotifyWrapped crowd exceeds the affinities evident among the general Spotify online audience.
While quite popular in certain circles, it seems evident hat Spotify is a platform where these artists are still finding their respective footings.
Some additional names that have found their way onto this list that are worth noting are FKA twigs, whose 2019 release, ‘Magdalene,’ is not merely gracing, but topping many critics’ “Best of the Year” surveys, and Japan’s Babymetal.
If unfamiliar with the latter, but the marriage of sugary-sweet, J-Pop idol music and ferocious speed metal sounds like something up your alley, then you’ve been missing out for about five years or so, now.
The one act that might arguably buck expectation when dealing with such a young audience is Britain’s Gorillaz.
The stadium headlining virtual band was started by Damon Albarn, originally of the band Blur (relatively big in the states, positively massive in the U.K.), over 20 years ago. The band’s co-founder, Jamie Hewlett, is a cartoonist, well-known, at the time the group formed, for his strip ‘Tank Girl.’
50-somethings, or not, the kids love them.
— — — — — — — —
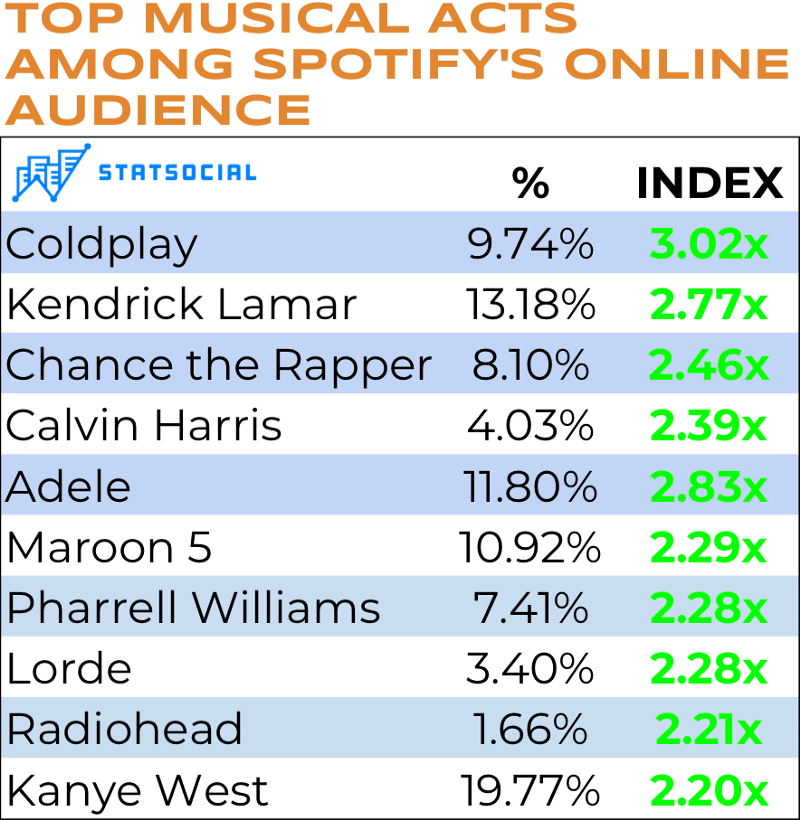
Returning to the average American online audience as our baseline, we’ve also calculated which musical acts resonate most strongly with Spotify’s general audience.
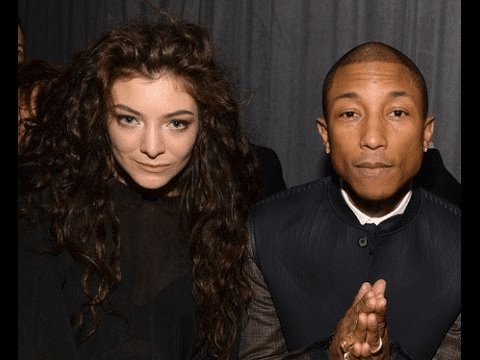
The acts are more established, more veteran (with Lorde being, what, 23, it’s difficult to say she’s a veteran, but for our purposes she is). These are the sorts of giant megastars you might expect to see here.
Lorde (left) and Pharrell Williams (right)
Still, love for Coldplay among the greater Spotify audience exceeds the percentage of fans you’d find among the average American online audience by 3.02 times.
We provide this statistic without comment.
BACK TO THE MATTER AT HAND
Returning to strictly the #SpotifyWrapped audience, and to solely using the average American online audience as our baseline, let us continue.
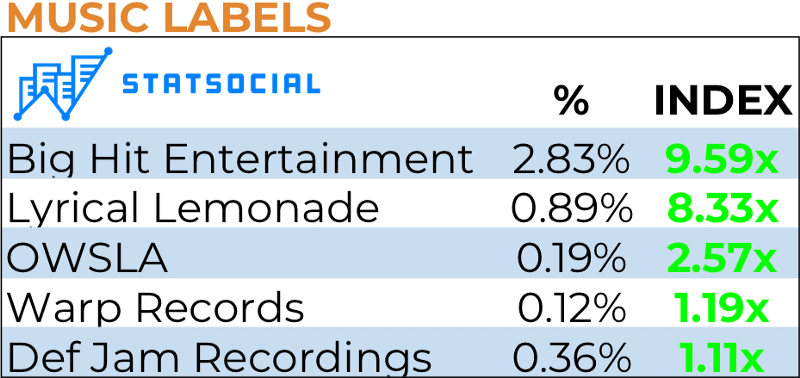
Here’s a matter of importance. Labels, as such, are not quite what they were, as some don’t really deal in the production and distribution of physical media at all. They’re more, like, managers and PR firms… But whatever they are, these are the five for which the #SpotifyWrapped bunch displayed the strongest affinity, and that over-indexed most dramatically against the baseline.
Big Hit Entertainment brought us, and your tween, BTS. Their name brings to mind that old adage that it ain’t bragging if it’s true.
Cole Bennett’s Lyrical Lemonade is a good example of a company that isn’t quite a label, but a multimedia production and promotion company.
OWSLA is an Atlantic Records distributed label, co-founded by Skrillex.
Warp is a legendary British electronic label, and home to absolutely essential albums by the likes of Aphex Twin, Squarepusher, and Autechre.
And, well, you all know what Def Jam is.
OTHER MEDIA AND BRAND AFFINITIES
AH, but Spotify is not just about music. It’s about streaming audio of all types. The platform is, accordingly, a major one for podcast listeners.
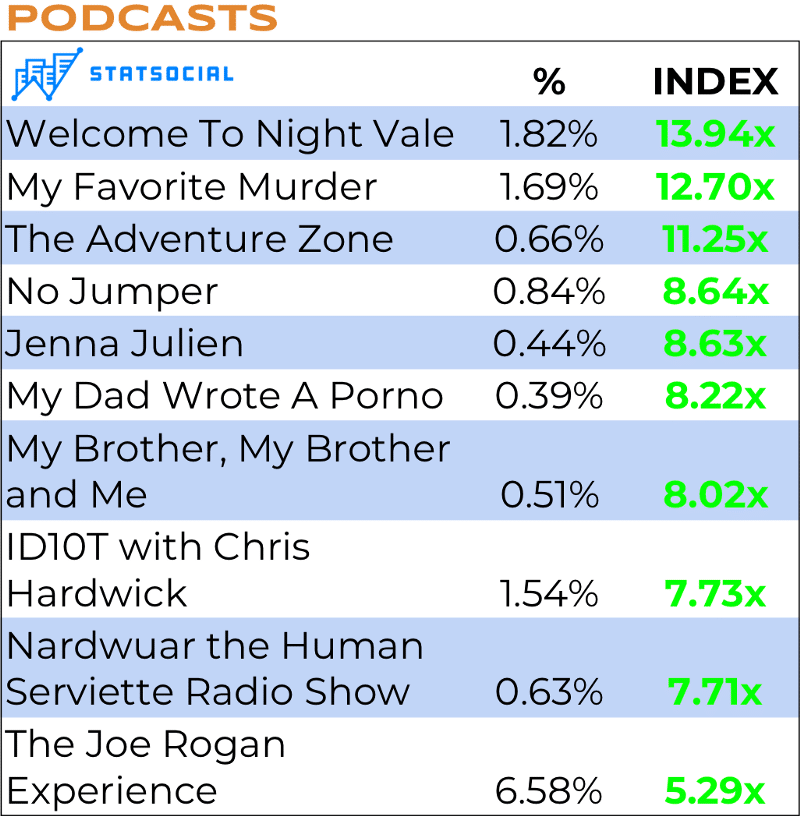
Below are the 10 podcasts whose love among the #SpotifyWrapped crowd over-indexes most profoundly when compared to the average American online audience.
A fun combination of popular, but largely quality podcasts. While the medium’s current king, Mr. Joe Rogan, appeals to the largest percentage of this audience, and that percentage exceeds the baseline by a rather significant 5.29 times, he’s still at the bottom of this list.
If you’re not familiar with Nardwuar the Human Serviette, do yourself the immense favor of becoming so, post-haste. There is no interviewer in the business who comes remotely close. A true force of nature, and one receiving love from the #SpotifyWrapped audience to a degree exceeding the baseline by 7.71 times.
The podcast of one of the most widely-loved veteran mega-YouTubers, Jenna Marbles, and her longtime boyfriend, Julien Solomita, find their usually endearing show ranking here in 5th place, exceeding the baseline by 8.63 times.
The McElroy brothers, of both the ‘My Brother, My Brother & Me’ and ‘The Adventure Zone’ podcasts.
The winners here, however, would be podcasting’s first family, Justin, Travis, and Griffin McElroy. Their podcasts ‘My Brother, My Brother & Me’ and ‘The Adventure Zone’ have both rated highly; exceeding the baseline by 8.02 times and 11.25 times respectively.
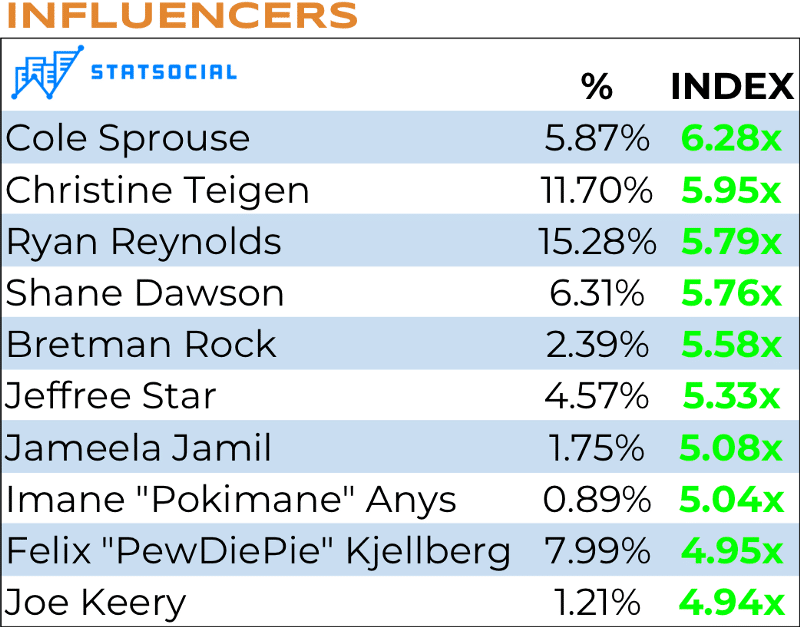
Former Disney Channel, ‘Suite Life’ star Cole Sprouse, is all growded up now. He, of course, plays Jughead on the CW’s “dark Archie” mystery-drama, ‘Riverdale.’ He receives affection from the #SpotifyWrapped crowd to an extent that exceeds the fondness for him you’d find expressed among the average U.S. online audience by 6.28 times.
Twitch/YouTube star, Pokimane, earns a slot on the list, as does the YouTube creator with whom she briefly had beef at the start of 2019 (although he’s well-known for a great deal more than that, such as the fact that he’s the first independent YouTube creator to ever come anywhere close to having 100,000,000 subscribers, a number he has surpassed), PewDiePie.
Two YouTube behemoths who, for whatever reason, go mostly ignored by the mainstream media, both rate highly with the #SpotifyWrapped crowd: YouTube veteran, and platform superstar, Shane Dawson, and beauty influencer extraordinaire, and cosmetics mogul, Jeffree Star.
Jeffree Star (left) and Shane Dawson (right) in an ad for their record, and internet, breaking makeup palette collab, ‘Conspiracy.’
In October, Shane began to upload his docu-series, ‘The Beautiful World of Jeffree Star.’ Filmed between February and November of 2019, the series documented the soup-to-nuts process of Shane, a cosmetics novice, and Jeffree developing a makeup palette (and a whole line of other products) together.
The launch of their collaborative collection was the biggest of its type in the history of the cosmetics industry. Nary a peep was detectable, however, among the mainstream. The young folks know, nevertheless, that Shane and Jeffree are as famous as any movie star, and probably as famous as the host of any late night talk show, or TV actor. The #SpotifyWrapped gang stans the pair to degrees exceeding the average American online audience baseline by 5.76 and 5.33 times respectively.
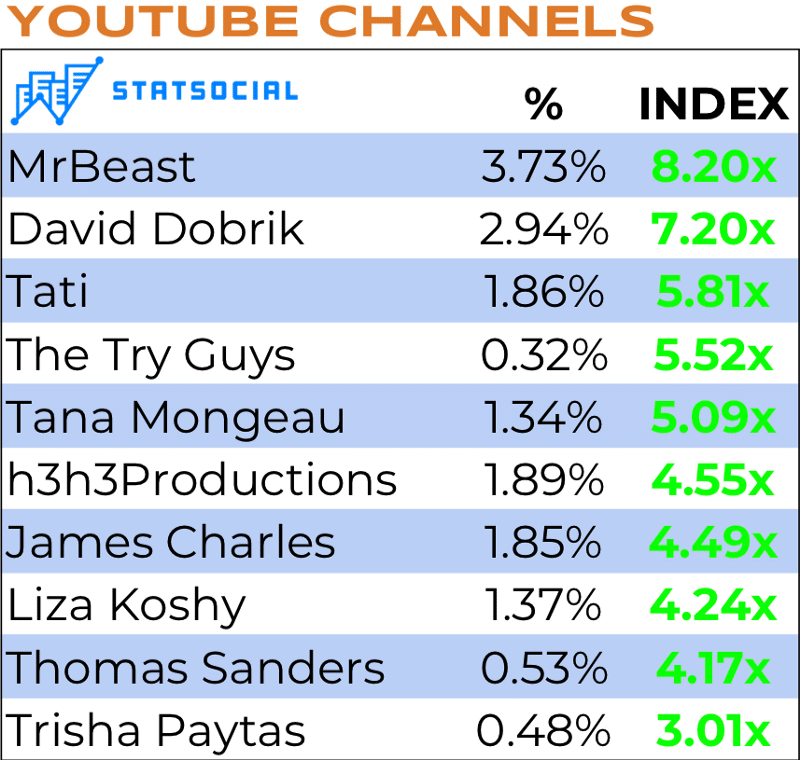
While on the subject of YouTube…
All big channels, all featuring widely-known creators. This has been a massive year for MrBeast, however. Only 21-years of age now, and in charge of what appears to be a sizable production operation, his endurance and philanthropic stunts routinely garner millions and millions of views each.
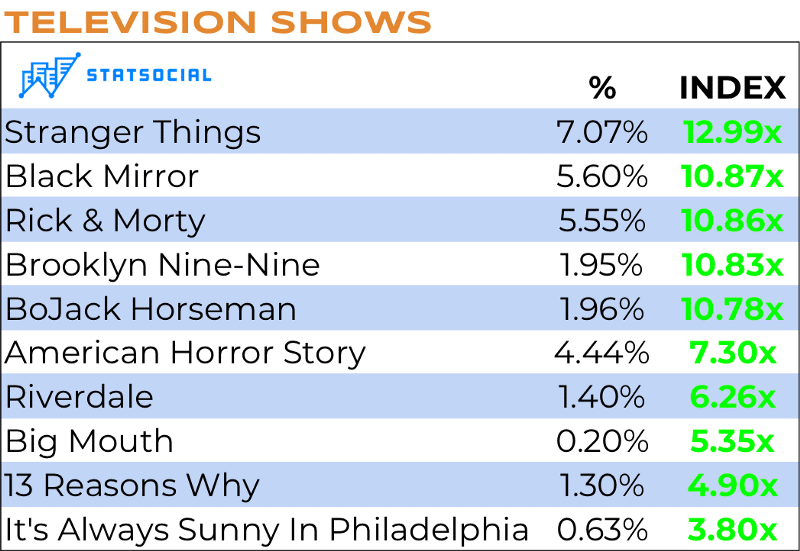
What can be said about the above, except that half the shows on it are Netflix series, three of the shows on it are animated (albeit, not precisely appropriate for children), and all of it seems pretty consistent with what you’d imagine the 18 to 24 set viewing.
Five of the TV programs that resonate most profoundly with the #SpotifyWrapped audience are Netflix original series.
Still, each of these programs finds that they receive a quantity of love from the #SpotifyWrapped audience that rather dramatically exceeds what you’d find among the average U.S. online audience.
And finally, because we must.
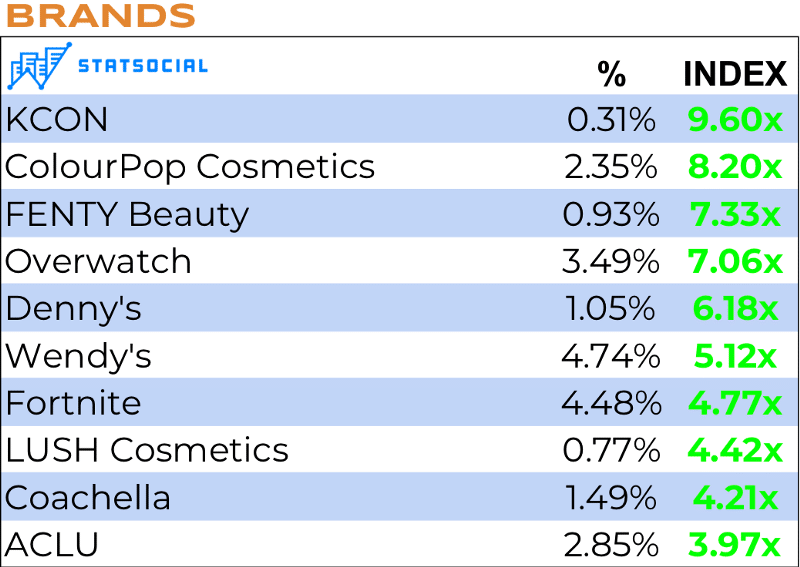
These brands, as it turns out, are very “on brand” with the audience that has revealed itself throughout this entry. Cosmetics brands rate highly, as do two restaurant chains, and two widely-played video games.
The list is topped by KCON. If you’ve been following you may guess correctly, more or less, what KCON is (hint, those are not the call letters of a west coast radio station — well, they may be, but that’s not what this KCON is).
KCON is an event, hosted all over the world, but recent years have found it taking place in various U.S. locations. It features a huge array of South Korean idol acts, participating in Q&As, meet and greets, and of course performances. Merchandise and collectibles are for sale, there are panels, and the whole shebang. Our hearts go out to every father loving and patient enough to spend three days in such an environment.
KCON 2019, at New York’s Madison Square Garden.
Anyway, the #SpotifyWrapped contingent exhibits fondness for KCON to a degree that exceeds the baseline by 9.60 times.
We’ve gone on long enough. Please peruse the footer!
Salesforceand HubSpotare cooperative and competitive. Their flagship platforms can be integrated, but also serve different functions, needs, and sometimes customers. Instead of comparing what each platform offers, we’ve set about contrasting the actual users who are already being served. In doing so, we’ve demonstrated StatSocial’s ability to provide the most in-depth customer insights available on the market today.
Check out the piece below to discover key differences across not only basic demographics, but also top brand and media affinities, influencers, personality traits, and Digital Tribes.
A Brief Summary of HubSpot and Salesforce
Salesforce is the king of the CRM mountain, and the fastest growing company in the sector, in terms of revenue. Their name has become a bit of a genericized trademark along the lines of Band-Aid or Kleenex.
HubSpot has quickly become the next most uttered name in the CRM discussion, having carved out a niche for themselves by serving the needs of smaller and/or younger businesses and sales teams.
HubSpot offers a surprisingly robust, free version of their platform. Easy to use, and minimally disruptive to a team’s existing workflow. HubSpot is ideal for those new to CRM, and/or those who feel underserved by their current systems and are looking to branch out.
HubSpot does, however, offer expanded, premium versions of their platform’s features. Contrasting with Salesforce’s annual subscription packages, HubSpot employs a feature-by-feature, cafeteria-style pricing model.
An Explanation of the Insights Below:
The index scores in this entry (the numbers styled as 0.00x in the charts) quantify the extent to which the corresponding percentage is in excess of, is in line with, or falls short of the baseline.
For this study, the baseline is the average degree to which a piece of demographic info, an affinity, a habit, a personality trait, a fondness for a work of media/media property, or membership in a Digital Tribe is detectable among the entirety of Americans online.
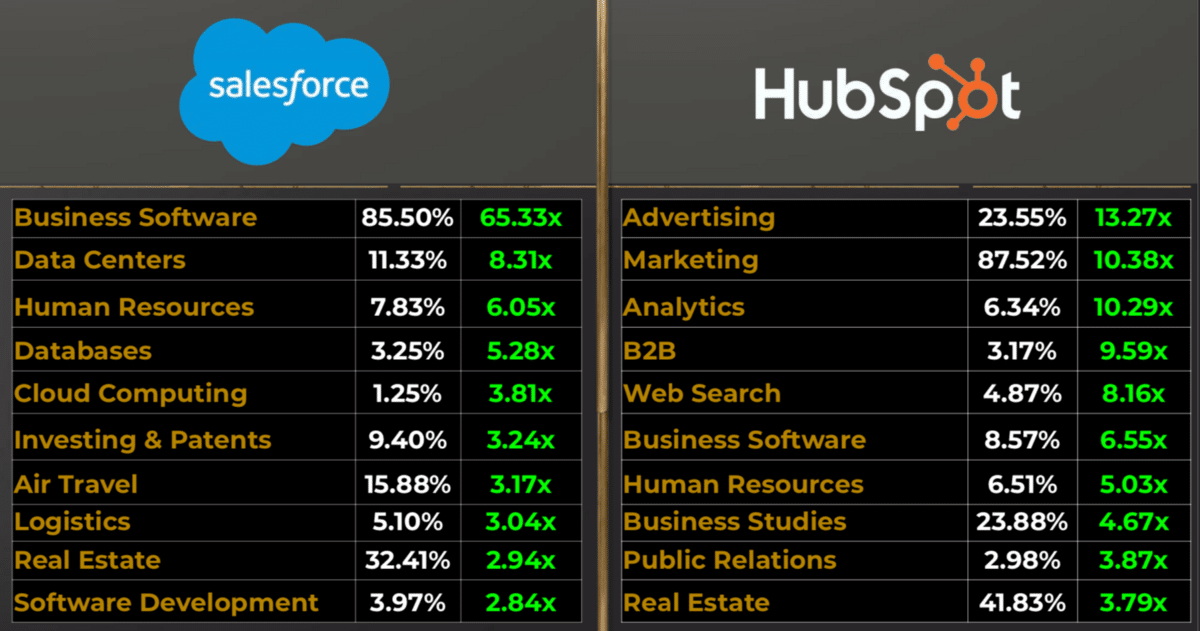
By looking at the strongest interests among Salesforce’s and HubSpot’s most dedicated customers, one begins to detect that each platform more commonly lands within the purview of different departments.
While each platform can count those with an interest in both technological and explicitly business-related matters among their top customers, the audiences decidedly lean one way or the other.
The top general interests among HubSpot’s customers are advertising and marketing. The former is an interest identified among 23.55% of their users, a quantity exceeding the baseline by 13.27 times. Marketing is an interest shared by 87.52% of their customers, which exceeds the baseline by 10.38 times.
Reflective of the oft celebrated ease with which the platform can be used, control of HubSpot — within the workplaces of what our insights reveal to be a large number of their users — seems to very possibly rest in the hands of the non-I.T. staff. Being a CRM tool, naturally that most often would be those who work in sales and marketing.
As HubSpot is concerned with inbound marketing, lead generation, and sales, and is designed to be quickly adopted in a hassle-free way, it stands to reason that its most ardent stans are not those up to their elbows in software, systems, and code.
While an interest in business software is detectable among both groups of customers — as no do
ubt it would be — it is far and away the most dominant interest among the Salesforce audience. That interest is evident in over 85% of their users, a quantity exceeding our baseline by 65.33 times. Add to that the facts that their second most prominent interest is in data centers (a concern detectable among 11.33% of the group, a quantity exceeding our baseline by 8.31 times), and that cloud computing occupies the thoughts of a segment 3 ⅘ times greater than what you find when looking at the entirety of Americans online, and, well…
Let’s just say that we find ourselves resisting the temptation to portray this as a “jocks vs. the nerds” type scenario. We’ve sworn, however, to forgo any and all such metaphors unless and until “rockers vs. the mods” can reasonably be used. Clearly, that is not the case yet.
In truth, though, Salesforce is a considerably more sophisticated platform with a whole battery of functions, potentially extending into all areas of an enterprise. Conversely, HubSpot have positioned their platform as being easy enough to use that a company with no I.T. department of which to speak could still hit the ground running, using it in no time.
BOTH platforms are used by sales and marketing, as should go without saying, and our findings do support this. But there’s a fair bit more know-how required to get the most out of Salesforce. It stands to reason that the common concerns of those who work both with and in I.T. (i.e., those matters of a more techie nature) would rise to the top.
Behold the general interest numbers in chart form:
HubSpot’s usefulness as a free, or inexpensive, enhancement to other marketing automation and management platforms is directly reflected in their users’ favorite business software brands.
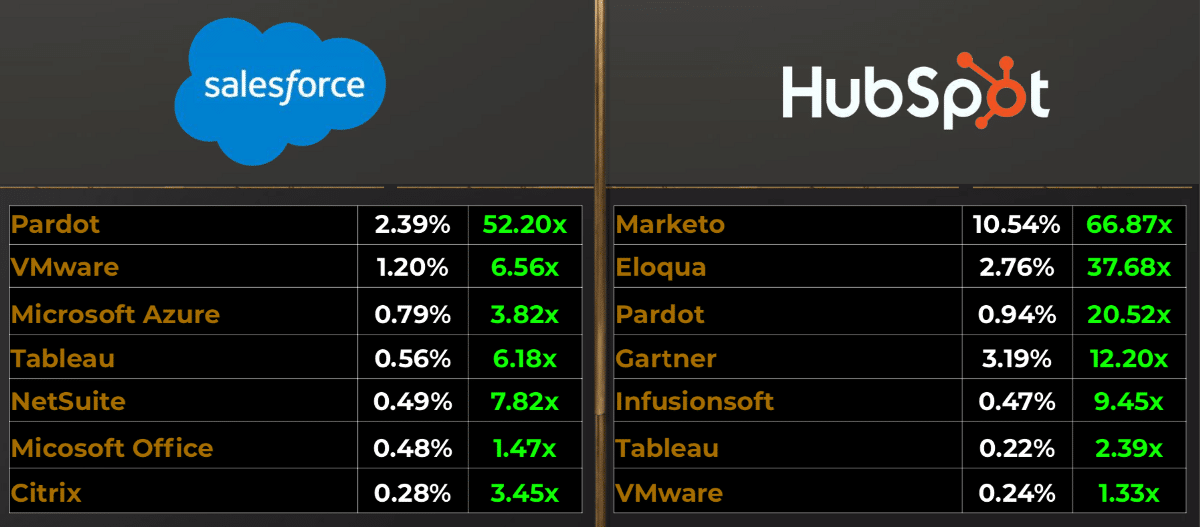
Marketo, and their toolkit of “complete Engagement Marketing Solutions” ranks highest of all business softwares favored by HubSpot’s customers. A quite significant 10.54% of their customer-base also belongs to that of Marketo. This percentage exceeds the baseline by a rather dramatic 66.87 times.
Oracle’s marketing automation platform, Eloqua is also a favorite among the HubSpot crowd, with the portion of their audience adopting the service exceeding the baseline by 37.68 times.
Salesforce’s customers, on the other hand, prefer to keep their solutions close-to-home before looking elsewhere.
HubSpot integrates easily and well with Salesforce, and provides an affordable means of enhancing the latter’s features. But the business software most dramatically finding favor among Salesforce’s users is the company’s own Pardot. The segment of their audience who identifies as using their homegrown marketing automation platform exceeds the baseline by 52.20 times.
Dipping a fair bit in terms of the degree to which it over-indexes against our baseline is the second most favored business software among Salesforce’s customers, the Dell Technologies owned, cloud computing, virtualization platform, VMware. Its users can be found among the CRM giant’s customers to a degree exceeding the baseline by 6.56 times.
For quick and easy reference, here are the business software affinity stats for these audiences, displayed graphically.
Those marketing mods of HubSpot, once more, face off against the rockers of Salesforce.
By looking at the non-business-software brands rating most highly with the customers of each platform, a tale as old as — well, at least as old as the start of this entry, but truthfully quite a bit older than that — again reveals itself.
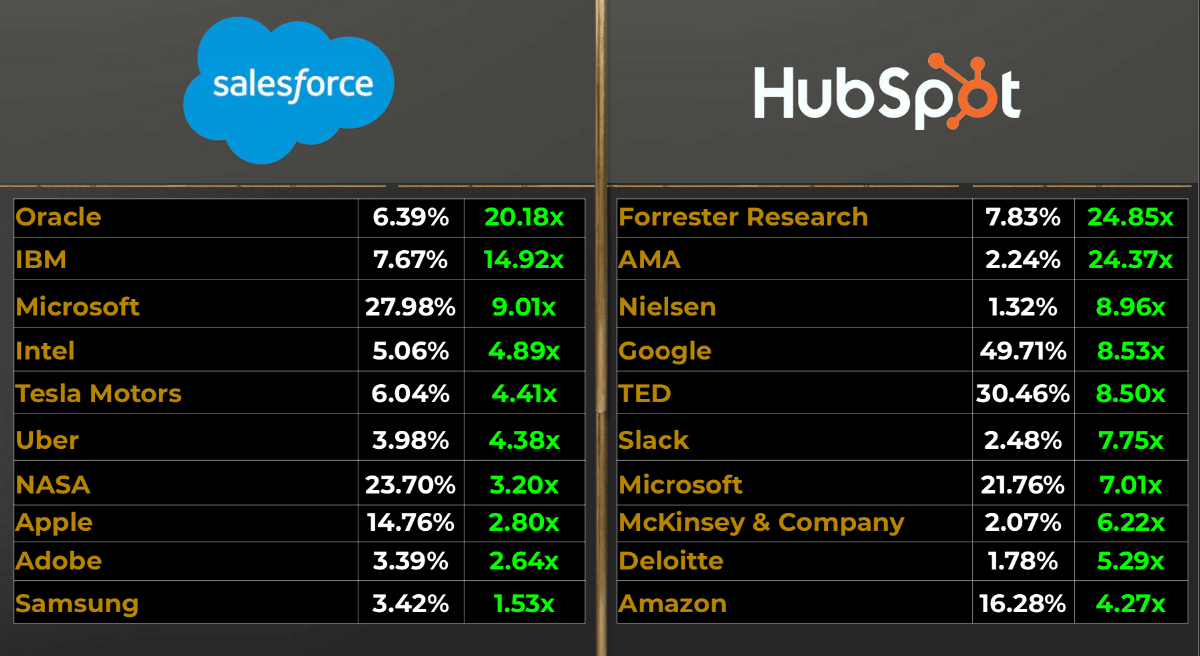
Tech-oriented market research firm, Forrester Research, can boast that 7.83% of HubSpot’s crowd are their customers & readers (a proportion 24.85 times greater than what’s found when observing U.S. netizens as a whole). Even more telling, the industry best-practices oriented, American Marketing Association, finds enthusiasts among this crowd to an extent 24.37 times in excess of our baseline.
And those techie types, maintaining and applying Salesforce’s considerable capabilities to the needs of their workplaces, make themselves quite known when observing their favorite non-business-software brands.
The top brands with the Salesforce bunch is a bit of a who’s who of tech-giants: Oracle, IBM,Microsoft, and Intel all pop up. But check it out for yourselves below.
Explanation: 2.24% of HubSpot’s customers are members of the American Marketing Association (the AMA named above), this quantity exceeds what you’d find among American internet users as a whole, by 24.37 times.
Statistics are unconcerned with your — or our — narratives. Alas, if only anything could be so neatly summarized as the jocks and nerds of popular fiction.
On the other hand, when perusing the popular media consumed by these groups, one side of this equation does still present a bit more, shall we say, cerebral.
The movers and shakers populating HubSpot’s gang of most dedicated customers enjoy their television, primarily, as it exists later in the evening (perhaps after a hard day at work, selling stuff, using HubSpot all the while).
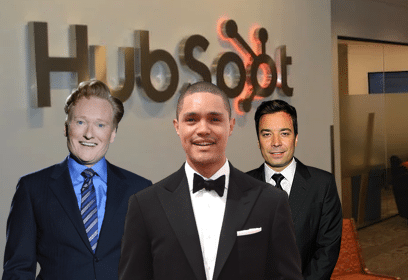
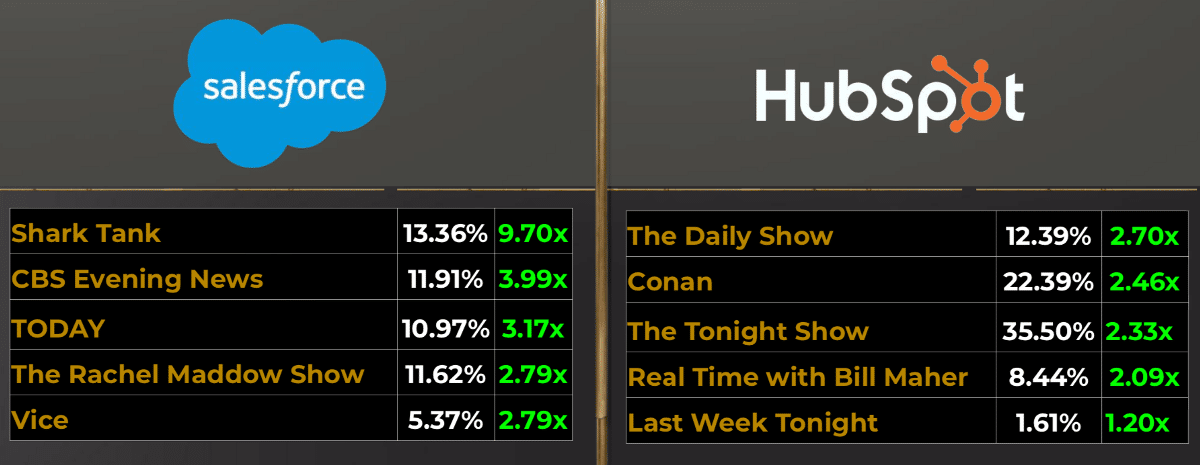
Of TV’s offerings, Comedy Central’s ‘The Daily Show with Trevor Noah’ is most prominent here, appealing to 12.39% of HubSpot’s users (a quantity exceeding the baseline by 2.70 times). Next on their list are ‘Conan,’ and ‘The Tonight Show Starring Jimmy Fallon.’
The true nature of this group, though, shines through brightly upon noticing that the top podcast with this audience, Social Media Examiner’s ‘Social Media Marketing Podcast.’ It counts 2.85% of HubSpot’s customers as listeners, a quantity that exceeds our baseline by a considerable 15.98 times.
Venturing over to YouTube: the Charisma on Command channel shares with viewers analytical breakdowns of various figures from current events and popular media. The channel provides analysis and insight into what it is that makes these figures charismatic, or conversely where they’ve not quite adequately accessed their powers to attract and influence (matters of natural interest to those in sales and marketing). It is viewed by a portion of HubSpot’s audience that exceeds the baseline by 18.03 times.
“But what,” you may be asking, “of Salesforce’s customers?”
And you’re right to ask.
The top TV programs with the Salesforce crew are not, as lists featured in this entry up until now might suggest, explicitly tech related. They are, more so than not, at least in the upper reaches of their list, news programs. Big news broadcasts, some with roots extending nearly all the way back to the birth of the medium: ‘CBS Evening News,’ of which 11.91% of Salesforce’s customers are viewers, a segment size 3.99 times greater than what you’d find among the U.S. online audience. 10.97% of this audience — a percentage exceeding the baseline by 3.17 times — regularly tunes into NBC’s eternal ‘TODAY.’
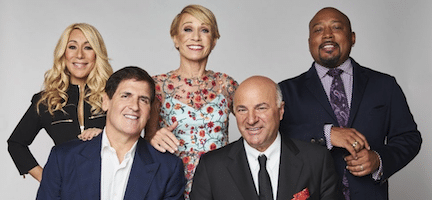
The ‘Shark Tank’ gang.
The top TV show, however, is arguably lighter fare, but also a bit more blatantly concerned with matters of a business nature. American TV’s monument to the entrepreneurial spirit, ‘Shark Tank,’ is the number one show with this gang. Having recently wrapped its 10th season, the show is a favorite with 13.36% of the Salesforce audience. This quantity exceeds the U.S. average by 9.70 times our baseline.
The highest ranking media here continues to drift a bit from the I.T. orientation of some categories outlined above, and instead — particularly when it comes to favorite podcasts — sticks closely to the first syllable of the platform’s name. ‘The Brutal Truth About Sales & Selling’ is a podcast that caters to the “2B Social SaaStr Cold Calling SaaS Salesman Advanced Hacker” listener. The group of the Salesforce customer-base that are its fans are 6.77 times larger than what you’d find among the average U.S. online audience.
YouTube’s ‘The School of Life,’ a 4.7 million subscriber “channel devoted to self-knowledge and fulfillment” is the favorite on the platform among this audience. It finds fans here to a degree greater than the baseline by 4.46 times.
And the top 5 TV shows with each audience are…
When looking in to which of our Digital Tribes the members of each platform’s customer-base belongs, and in what proportions, nothing arises which dispels a “sales and marketing to the HubSpot side, and techies to the Salesforce” type narrative.
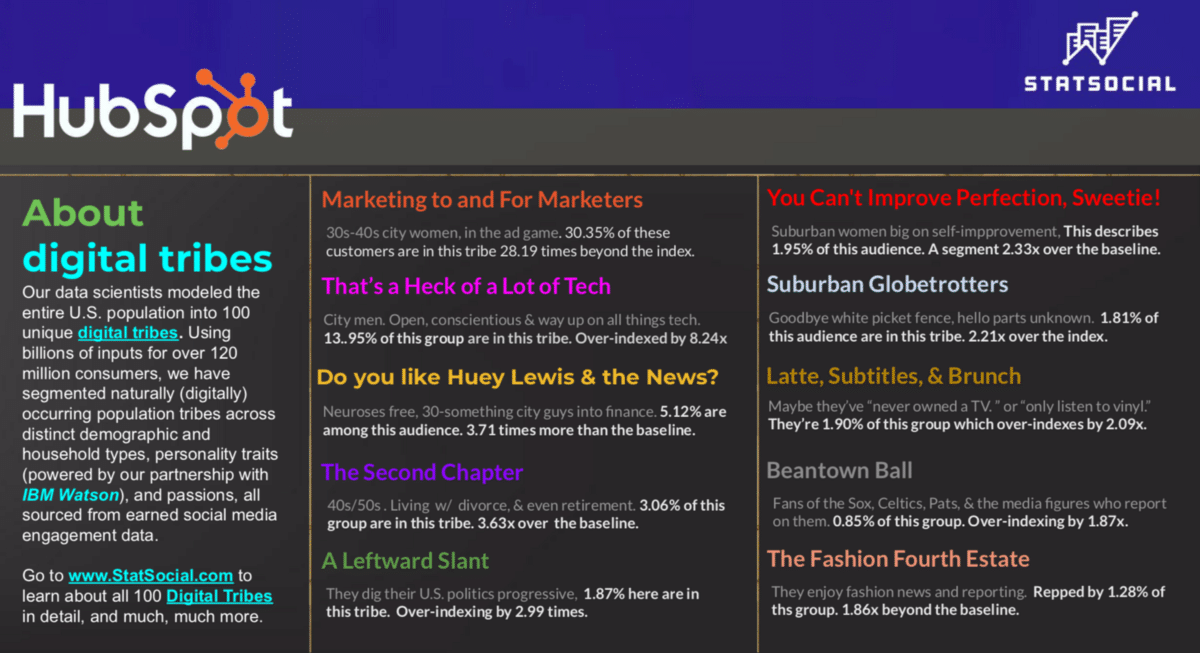
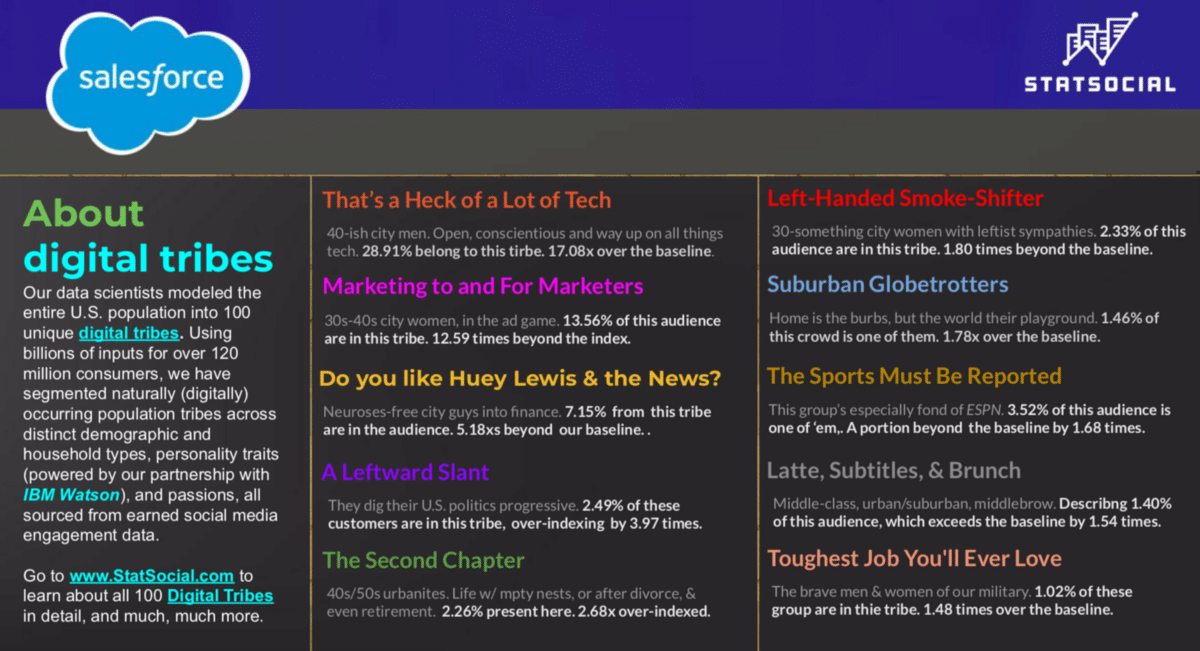
StatSocial Digital Tribes is a model of the U.S. population broken down into 100 distinct market segments (calculated by combining our demographic and affinity data with our Personality Insights® data; the latter powered by IBM Watson). Seeing which Tribes are present, and in what proportions, grants our users quick, crucial, and unprecedented insight into the humans who make up a given audience.
You can read more in depth descriptions of the Tribes mentioned below here, and you can read a blog entry going into the whole Digital Tribes matter a great deal more in-depth here.
The graphics below show the 10 best represented Tribes among each of the audiences being explored. An ever-so-pithy summary of the shared affinities, demographics, and/or personalities of each tribe is then provided. But again, we recommend you check out the more in-depth (albeit still brief) descriptions here, where you’ll find descriptions of the other Digital Tribes as well.
The comparisons above say as much about who is within each of these groups of customers as any featured in this entry. These are, of course, the top, most over-indexed results. Deeper digging — and please reach out to us for a demo, so we can show you just what that might entail — will reveal only finer detail, and reveal all the more subtle differences between the two groups.
Both platforms central to the workdays of those in sales and marketing, as well as those in I.T., and other tech-related positions within a company. The platform designed to be most easy-to-use and quick-to-adopt finds non-tech-sorts — or, more accurately interests and affinities — the most prominent among its audience. Conversely, the more robust, sophisticated, and all-encompassing platform requires I.T. for maintenance, scaling, customizing, and integration, with its fullest potential being realized by tech savvy sales and marketing sorts.
Most immediately telling — and of course confirming the basic narrative set out from the start — is that the Digital Tribe best represented among HubSpot’s customers is “Marketing to and For Marketers” (the name being rather self-explanatory), and the second most prominent is “That’s a Heck of a Lot of Tech” (same).
And of course, among the Salesforce crowd, the top two most prominent tribes are flipped.
BONUS
Usually we open with demographics, but here they make a nice epilogue.
While very important, and the bear minimum of what any reasonable customer would expect from an analytics platform such as ours, for the purposes of this entry, they weren’t necessary for demonstrating our ability to reveal the differences between audiences many would assume to be more or less statistically the same.
But you do want to know the demographics, right? Well, here they are:
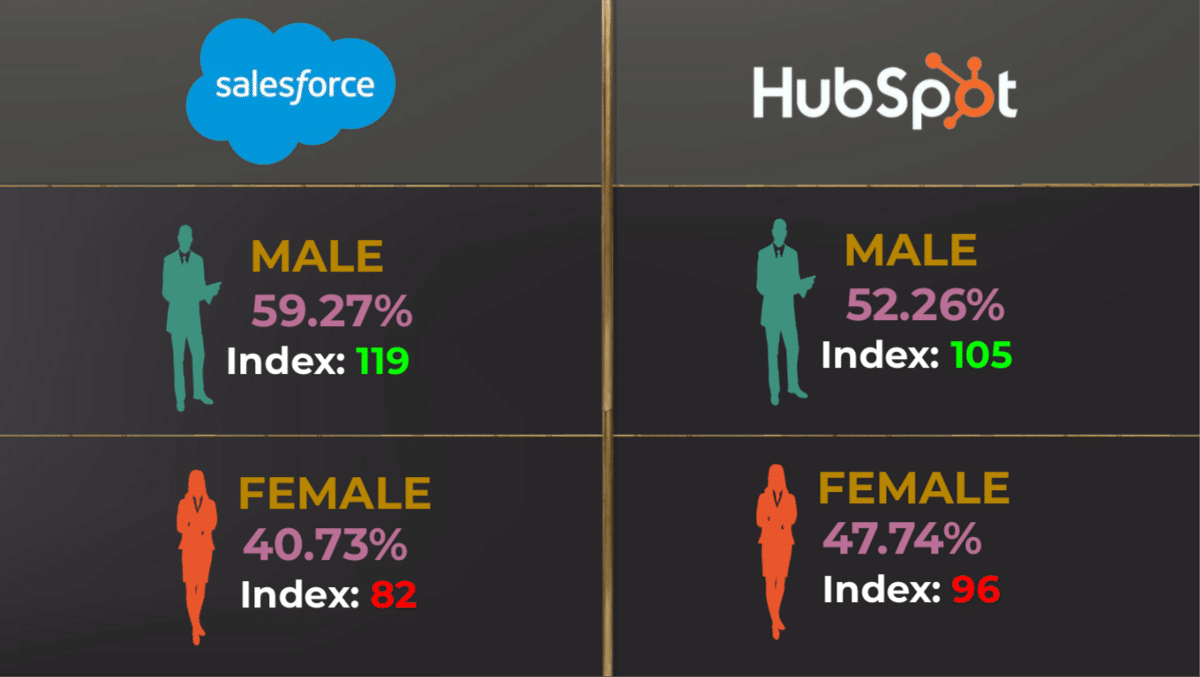
GENDER
Explanation: 59.27% of Salesforce’s customer-base is male. That percentage exceeds the baseline by 1.19 times. 52.26% of HubSpot’s audience are male, a quantity exceeding the full American online population by 1.05 times.
The gender split among the HubSpot audience being much closer to even is unsurprising, if the interpretations of the data up to this point have been accurate. Without involving ourselves in the greater discussion (except to say that there’s no reason for there to not be as many women as men in every field, and at every level; an opinion of ours we hope would be taken for granted), it is rather well-accepted that, whatever the reasons, women are historically under represented in I.T. roles, whereas they are some of the biggest names in sales and marketing.
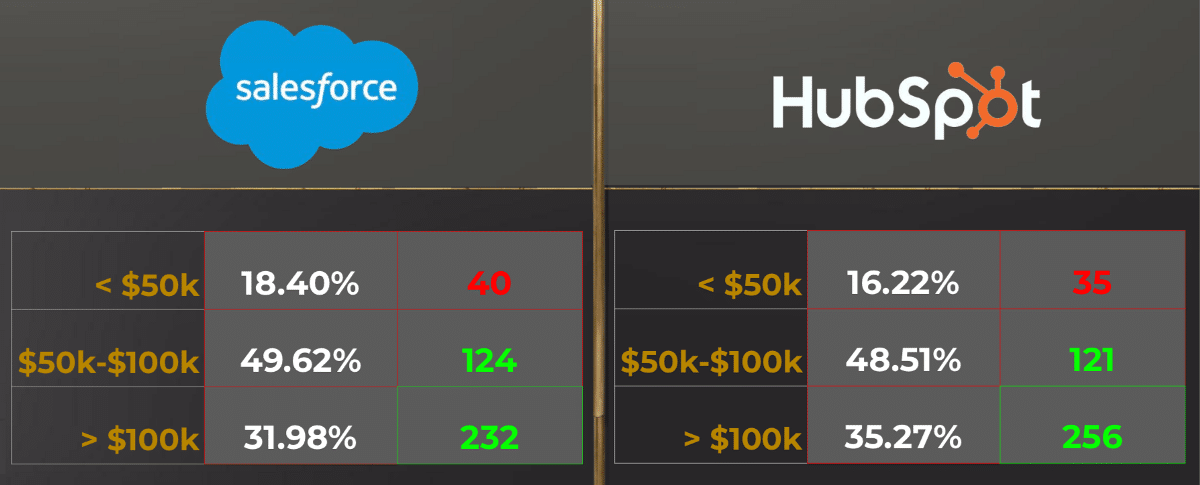
INCOME
In an overall way, these are two audiences who both earn extremely well, with over a third of the HubSpot audience earning over 100k a year. These are the kinds of customer statistics any enterprise platform would be pleased to see.
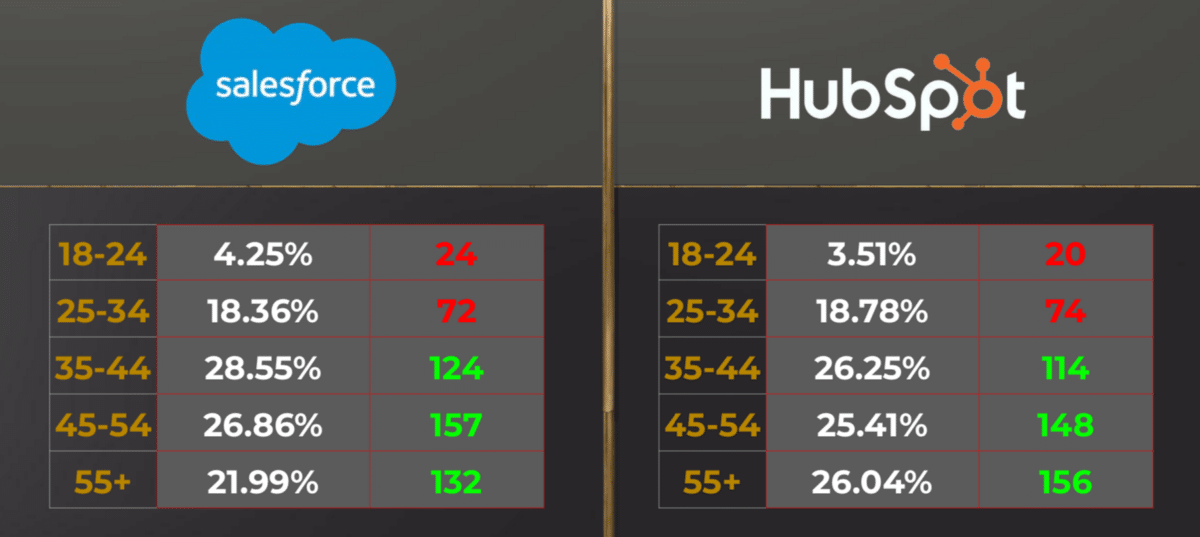
Both of these audiences skew older in comparison to our baseline of the entire U.S. online population. Those over age 55 are impressively well-represented, and account for over a quarter of HubSpot’s audience.
While the under-34 set fall below the baseline, they do still account for over one-fifth of each group of customers.
Insights on top of insights can be found by the curious reader who chooses to poke around the StatSocial blog here. Peruse the many entries, offering all kinds of insights, studies, and deep dives to better acquaint you with the capabilities of StatSocial.
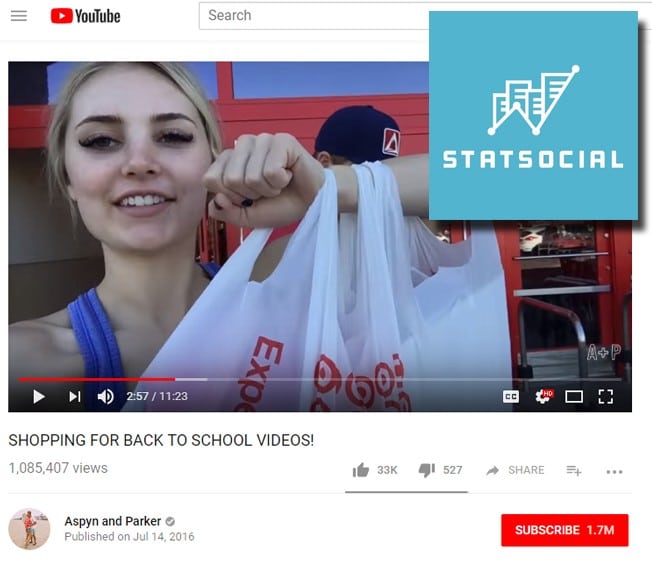
The month of August is here, which means that Back-to-School shopping season is peaking. Parents around the country are looking for the best deals for supplies and kid clothing, while companies are advertising heavily trying to reach its core audience during the annual Back-to-School frenzy. At StatSocial we recognize an opportunity when a social media trend correlates with an increase in commercial activity. Back-to-School season is a perfect way for us to demonstrate a brand new feature of our audience reports — specifically YouTube channel insights. For this analysis, we identify which YouTube channels are most relevant to Back-to-School shopping enthusiasts.
While advertising optimization has been traditionally focused on reach, forward-thinking brands are optimizing for ROI. Understanding the niche audiences that are best aligned is the first step in that process.
These insight can inform media buyers, very quickly increasing efficiency in targeting their most relevant audience while leveraging YouTube’s incredible reach. Media sellers on YouTube can also leverage this data to optimize their pitches and campaigns, ensuring they work with the best possible advertisers most aligned with their audience.
Methodology
We looked back over the past 30 days to identify a sample of approximately 25,000 consumers engaging with popular back-to-school (B2S) hashtags, including #back2school, #backtoschool, and #”backtoschool.” We then overlaid that audience against the 10,000+ media properties in our taxonomy, which now includes nearly 1,500 YouTube channels.
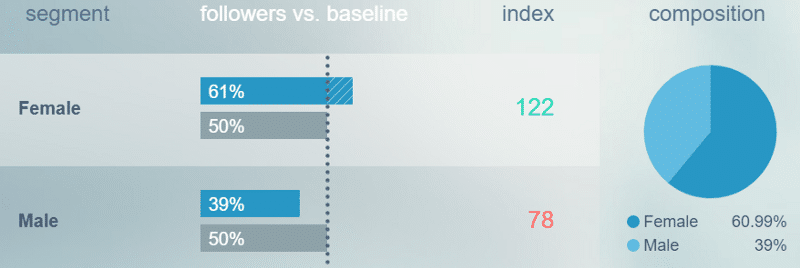
Back-to-School Audience Demographics
The B2S enthusiasts are then compared to the average American on social media, built off a baseline of more than 100 million people. We then can pinpoint what makes the back-to-school enthusiasts unique across a variety of demographic, psychographic, and affinity data points. Right off the bat, and perhaps not surprisingly, this is a majority female crowd.
StatSocial’s Media Taxonomy
Every StatSocial audience report includes over 10,000 media properties, encompassing movies, TV shows, YouTube channels, podcasts, websites, and more. Let’s zoom in on the YouTube channel affinities.
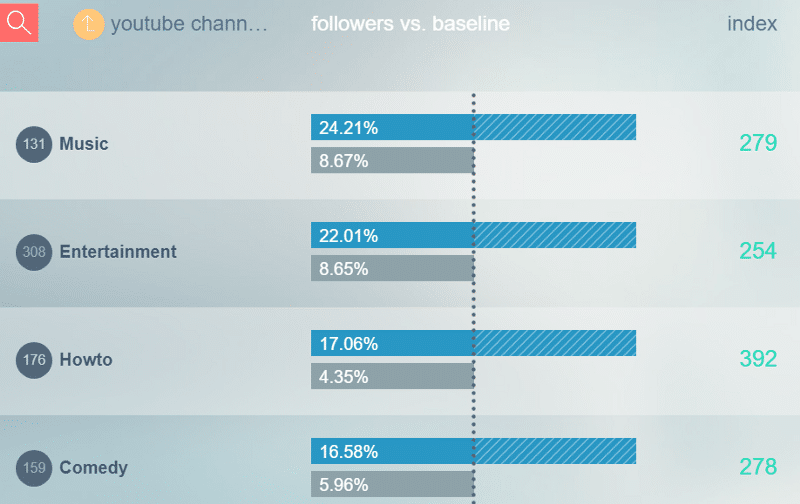
The leading YouTube categories for the pre-dominantly female B2S crowd are Music, Entertainment, HowTo, and Comedy. Interestingly, all of these top categories have a significant over-index which demonstrates that B2S audience is 3–4 times more into Music, Entertainment, Comedy and HowTo content on YouTube than an average social media user.
Back-to-School enthusiasts love YouTube
If we look at YouTube’s share within the entire media world, YouTube channels have the highest over-index compared to the other types of media.
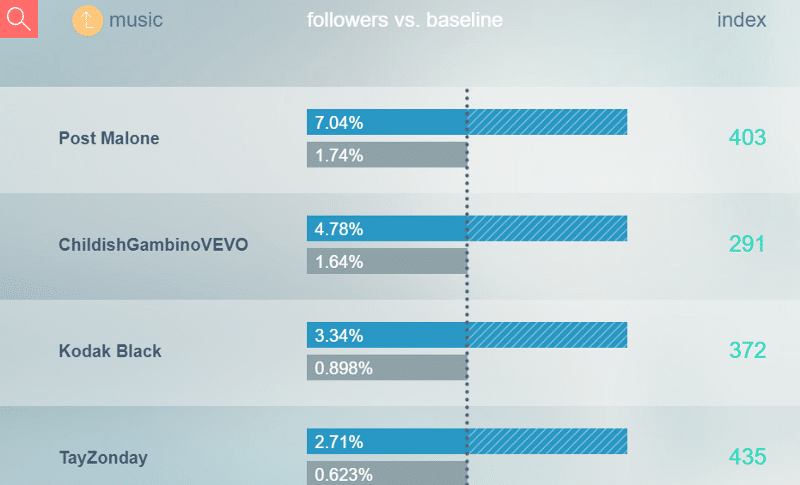
Back-to-School Shoppers Favorite YouTube Music Channels
Now, let`s drill down the YouTube taxonomy and identify which channels are most loved by the B2S enthusiasts. Starting with Music, we see that our audience enjoys watching videos of Post Malone, Childish Gambino, Kodak Black and TayZonday. All of these artists are significantly over-indexed against the average American, validating the fact that B2S enthusiasts strongly prefer these musicians on YouTube.
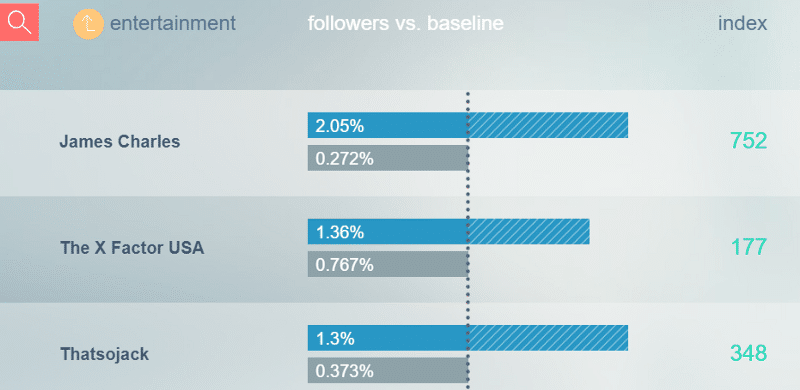
Back-to-School Shoppers Favorite YouTube Entertainment Channels
Next up are Entertainment channels on YouTube. James Charles is leading in this category with a whopping 752 index score! It means that B2S audience likes/shares/tags James Charles 7 times more than an average social media user. James Charles is an American internet personality, makeup artist, and model known for being the first male CoverGirl spokesperson. It is predictable that the women in this audience are interested in makeup, yet… out of a myriad of Internet personalities, celebrities and performers, James Charles gathers the most over-indexed fandom.
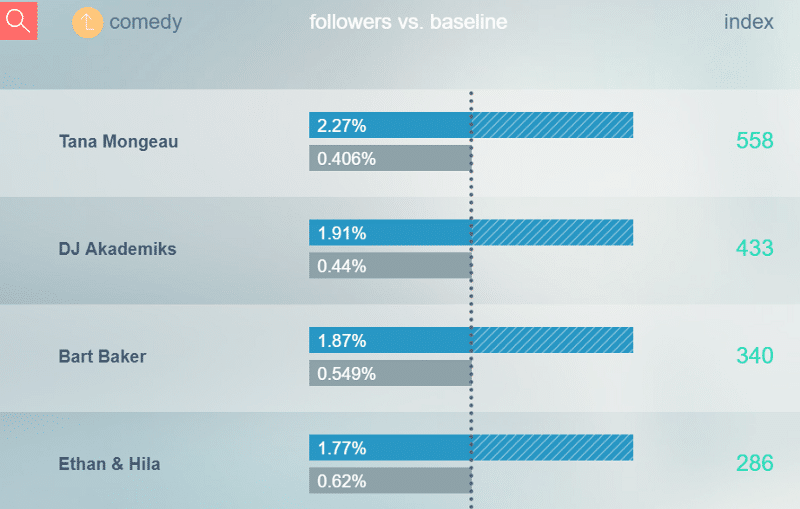
Moving on to Comedy-focused YouTube channels. We can see that our target audience is watching MANY comedians. There is no single comedy channel on YouTube that takes up a lion`s share of the B2S group. On the opposite, our audience likes a very wide range of channels that produce comedy content. Nonetheless, we can still see that Tana Mongeau and DJ Akademics have a significantly higher interest from the B2S than from average social media users in the US.
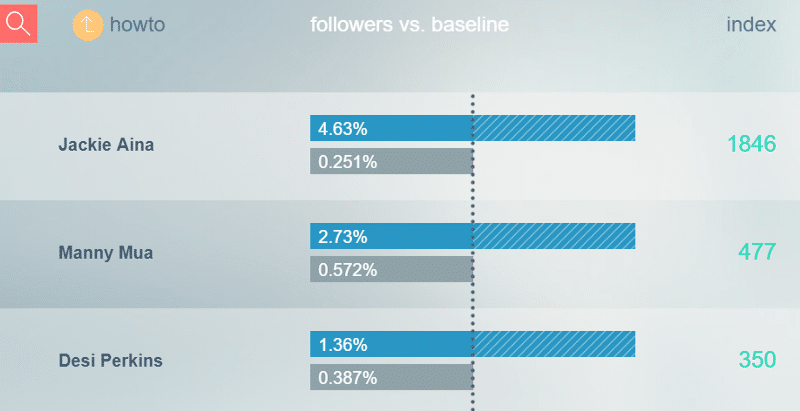
In the HowTo segment, Jackie Aina is leading the chart of the top HowTo vloggers for our group of interest. Her channel has a huge overindex of 1,846. None of the other channels from Music, Entertainment or Comedy segments have such a strong affinity to a seemingly niche beauty influencer: only 0.25% of social media users follow Jackie Aina online. It is very interesting that our B2S share so much affinity for this specific HowTo YouTuber.
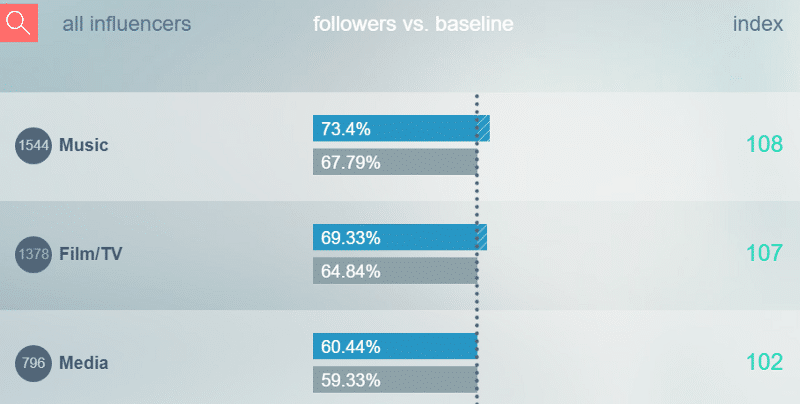
Back-to-School Shoppers Top Influencer Categories
Across Back-to-School audience’s top YouTube categories, Music has the most concentrated interest around the top channels whereas Entertainment, Comedy, and HowTo interest is much more dispersed among dozens of channels. We cross-checked this fact by researching Statsocial’s influencer taxonomy in the B2S report. Music was the leading influencer category, which shows that Music content is important to the B2S crowd within YouTube as well as outside of it.
If you are new to us, we are StatSocial, the leading social audience insight platform on the market today. We help brands, publishers, and agencies understand and target their audiences. We invite you to click HERE to check out our website. Please click around and explore some of our sample reports to get a sense of everything we can uncover.
We use cookies on our website to give you the most relevant experience by remembering your preferences and repeat visits. By clicking “Accept All”, you consent to the use of ALL the cookies. However, you may visit "Cookie Settings" to provide a controlled consent.
This website uses cookies to improve your experience while you navigate through the website. Out of these, the cookies that are categorized as necessary are stored on your browser as they are essential for the working of basic functionalities of the website. We also use third-party cookies that help us analyze and understand how you use this website. These cookies will be stored in your browser only with your consent. You also have the option to opt-out of these cookies. But opting out of some of these cookies may affect your browsing experience.
Necessary cookies are absolutely essential for the website to function properly. These cookies ensure basic functionalities and security features of the website, anonymously.
Cookie
Duration
Description
cookielawinfo-checkbox-analytics
11 months
This cookie is set by GDPR Cookie Consent plugin. The cookie is used to store the user consent for the cookies in the category "Analytics".
cookielawinfo-checkbox-functional
11 months
The cookie is set by GDPR cookie consent to record the user consent for the cookies in the category "Functional".
cookielawinfo-checkbox-necessary
11 months
This cookie is set by GDPR Cookie Consent plugin. The cookies is used to store the user consent for the cookies in the category "Necessary".
cookielawinfo-checkbox-others
11 months
This cookie is set by GDPR Cookie Consent plugin. The cookie is used to store the user consent for the cookies in the category "Other.
cookielawinfo-checkbox-performance
11 months
This cookie is set by GDPR Cookie Consent plugin. The cookie is used to store the user consent for the cookies in the category "Performance".
viewed_cookie_policy
11 months
The cookie is set by the GDPR Cookie Consent plugin and is used to store whether or not user has consented to the use of cookies. It does not store any personal data.
Functional cookies help to perform certain functionalities like sharing the content of the website on social media platforms, collect feedbacks, and other third-party features.
Performance cookies are used to understand and analyze the key performance indexes of the website which helps in delivering a better user experience for the visitors.
Analytical cookies are used to understand how visitors interact with the website. These cookies help provide information on metrics the number of visitors, bounce rate, traffic source, etc.
Advertisement cookies are used to provide visitors with relevant ads and marketing campaigns. These cookies track visitors across websites and collect information to provide customized ads.