The article speaks of the possibly forever altered world in which we find ourselves, and the unprecedented challenges businesses face as they seek to exist in it.
David takes care to observe that while we have to move forward, we must do so cognizant of the needs and sensitivities of consumers.
As he explains in this excerpt:
The worst thing businesses can do right now is to engage in opportunism. Every brand should be rightfully cautious with their advertising and messaging during a time of high sensitivity and upheaval. However, brands shouldn’t let the current moment’s complexity serve as an excuse to freeze in place. Paralysis is not an option—and that includes data-driven efforts to understand the needs of consumers in adjustment better. Especially when it comes to ecommerce, people still need brands to get them what they need despite ongoing challenges.
The article touts the virtues of earned data (“information derived from earned media — instances in digital and social media where influencers and other consumers mention or express their support for a certain company, issue, product, cause or interest”), and the ways that harnessing the insights it provides enhances traditional survey methods.
As David writes in his intro:
Surveys will always be a staple of the marketing research toolbox. But their limited sample size often limits their usefulness and reliability for informing decisions about digital marketing campaigns. Extrapolation beyond the bounds of the questions asked becomes a real problem. They’re also static, representing a snapshot in time of expressed opinions, and cannot capture the dynamics of attitude and sentiment shifts in real-time.
Here earned media comes to the rescue, finally making it possible to augment survey findings so they’re reliable at scale and across a longer time span. And with richer insights to boot.
We return to this blog today to share more insights reported by StatSocial’s Crisis Insights service. This particular chart will be updated on a weekly basis, each Monday/Tuesday.
For those new to Crisis Insights: The subscription service has been built using StatSocial’s Silhouette™ social data platform. The service is a tool for brands, marketers, and agencies seeking to understand the rapidly changing dynamics of their customers who, as a result of the uncertainty born of the COVID-19 pandemic, are finding their customer dynamics shifting during these trying times.
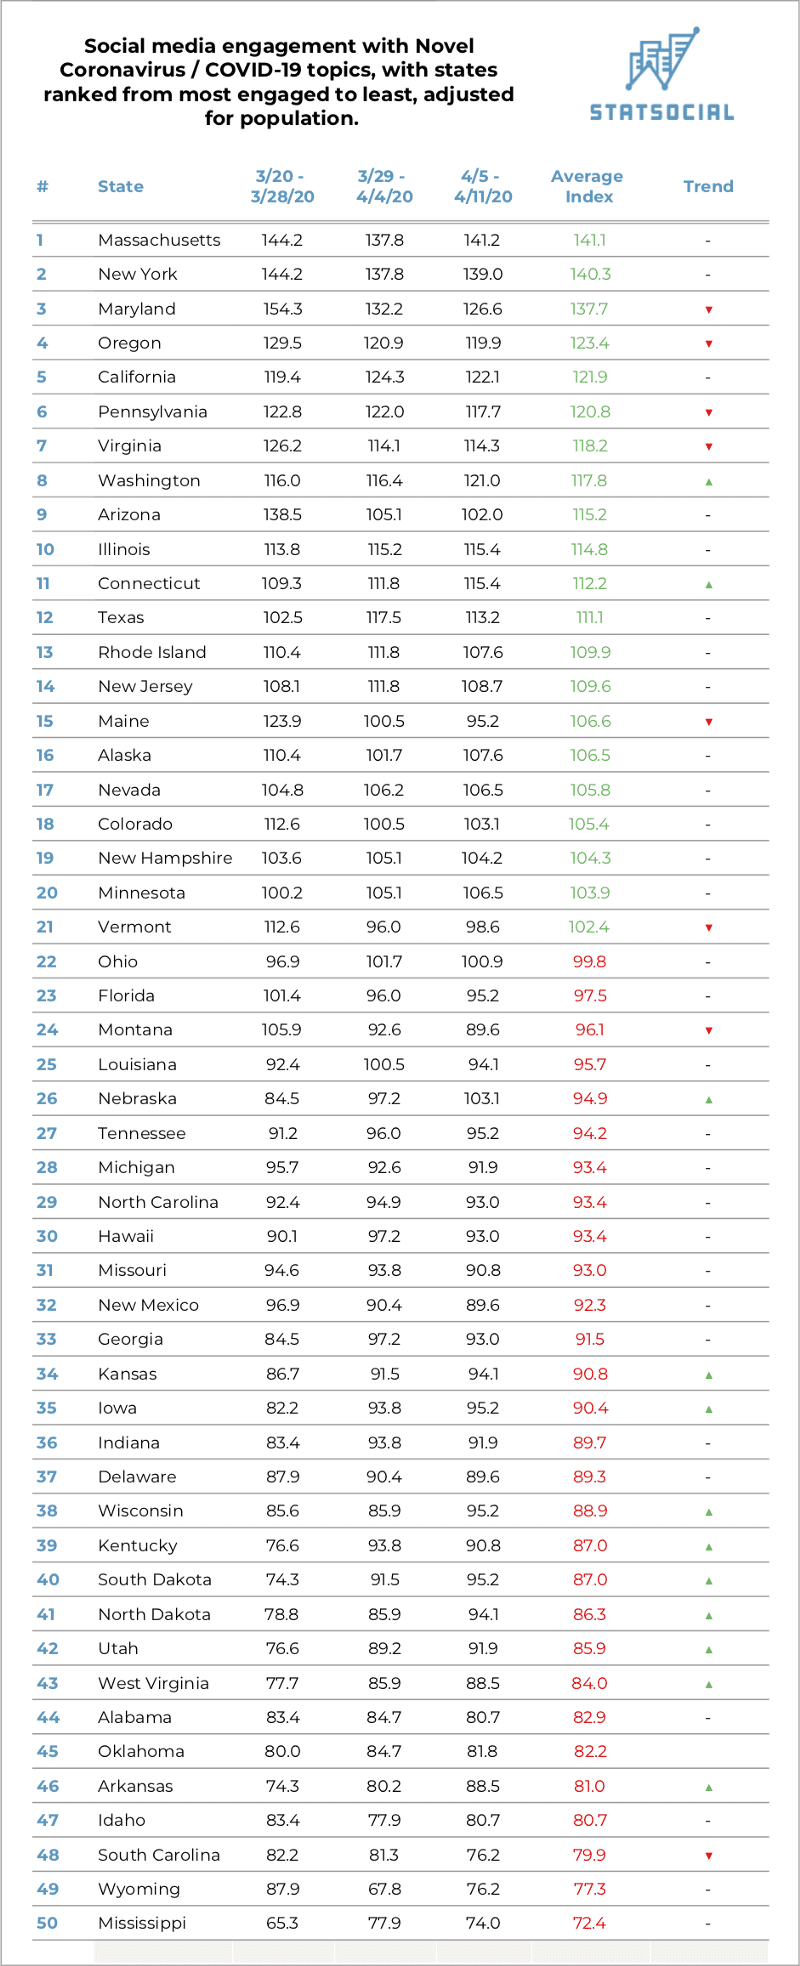
The 50 United States, ranked by online engagement with Novel Coronavirus / COVID-19 topics, from most engaged to least
Explanation of the above data: The scores on the above chart are index scores. Used for convenience here, these scores summarize, at-a-glance, the degrees to which social media content related to novel coronavirus / COVID-19 topics have been engaged with by the residents of each state.
The index scores are calculated based on contrasting the above described statistics with the entire United States population’s engagement with novel coronavirus / COVID-19 topics. A level score of 100 is used to represent this national number, and the scores on the above graphic report the degrees to which each state’s engagement is in excess of or is equal to (represented in green), or falls short of (represented in red) that baseline.
Each state’s engagement has been broken out by week (the first three to have transpired since Crisis Insights’ launch). This allows you to see how engagement has increased, decreased, or held steady week-to-week.
The data used for Crisis Insights’ reporting is collected and analyzed daily, and then reported to subscribers as rolling seven and 30-day averages (as well as a full data series).
In addition to the insights shared here — regarding where each state’s residents stand when it comes to engagement with topics surrounding the COVID-19 matter — this also offers a small glimpse into how our constantly revised, amended, and well-presented reporting allows brands to observe, compare, and retain context for customer behaviors, concerns, affinities, etc., as they shift, change, and are even replaced over the coming weeks and months.
Massachusetts is the top ranked state here, with its citizens’ engagement with online COVID-19 coverage exceeding the baseline by 1.41 times. The state’s week of highest engagement, to date, has been the week of March 22 to March 28. The week of March 29 to April 4 has, thus far, seen the lowest engagement from the state’s residents.
As of this writing, the state has been home to the third highest number of diagnosed cases, and the fifth highest number of confirmed deaths from the virus.
At the other end of the spectrum is Mississippi, which has thus far seen the 28th highest number of diagnosed cases. It has experienced the 26th highest number of confirmed fatalities resulting from the virus.
The state’s week of lowest engagement, to date, has been the week of March 22 to March 28. The week of March 29 to April 4 has, thus far, seen the greatest engagement from the state’s residents.
Finally, for now, of very real note is the upward trend in engagement detectable among many states currently found in lower half (mid-30s to high-40s). Kansas, Iowa, Wisconsin, Kentucky, the Dakotas, Utah, West Virginia, and Arkansas have all found their residents engaging with COVID-19 content to an increasing extent.
We eagerly invite you to visit our Crisis Insights page here, and to reach out to us to learn a great deal more about the service, and to check out a demo.
As before, and as always, we sincerely hope that all reading are doing as well as circumstances allow, and are safe.
What are Crisis Insights?
Crisis Insights provides subscribers with near real-time updates on how the unprecedented climate in which we all find ourselves is affecting consumer sentiment, both among the general public, as well as a brand’s specific customers.
Changes in consumer sentiment are tracked in this reporting, for 32 crisis-related segments, across four general categories:
People concerned about the Covid-19 epidemic
People concerned about the direction of the economy
People coping and adjusting to the ‘new normal’ environment
General attitudes and psychographic outlook of the population.
We encourage you to visit these previously shared Crisis Insights related posts:
We took a look at the personalities of those most actively engaged with COVID-19 content online:
Today, StatSocial has launched a brand new service, Crisis Insights, the first-ever audience insights service of its kind.
Built on StatSocial’s Silhouette™ social data platform, the service has been devised in direct response to the rapidly changing consumer climate, born of the COVID-19 pandemic.
Silhouette™ monitors and analyzes more than 1.3 billion social accounts, encompassing more than 70% of U.S. households. It is the only platform that tracks and segments social audiences at such a scale.
Crisis Insights reports on the constantly evolving dynamics of consumers, engaging with 30 topics across across four major categories:
Coronavirus/COVID-19 (e.g. medical influencers, elder care, health treatments)
Preparedness (home security, social isolation, stockpilers, parenting during crisis)
Economy (Business Travelers, Working From Home, Job Security, Stock Market)
In nearly real time, Crisis Insights offers users a window into the quickly developing concerns, behaviors, outlooks, and preferences of consumers. The entirely new and distinct audience segments being created by our current, unprecedented climate are being identified, described, and defined; including from which media sources and influencers these segments are getting their news and information.
These new audience segments are combined with Silhouette’s psychographic data, and our taxonomy’s over 85,000 consumer attributes, giving CMOs and analytics teams a nearly immediate understanding of a given moment’s market dynamics. From there, the best informed, and most current and relevant choices can be made.
In a statement, released today, StatSocial’s CEO, David Barker, was quoted as sharing the following:
“The response to our new service has been overwhelming. We are already working with the CMO of a major electronics manufacturer that sells through retail stores. With that channel now on hold, we’re helping them identify new customer segments based on their responses to the crisis. A political campaign has asked us to provide daily insights on voter sentiment and dynamics across these affected groups. Lastly, a media platform has asked us to update our crisis data to their taxonomy on a daily basis so it is available to their customers.”
You can check out the full press release at the link below:
We also recommend visiting our blog beyond this entry, where numerous studies, deep dives, comparisons, and other fun and informative entries can be found.
Salesforceand HubSpotare cooperative and competitive. Their flagship platforms can be integrated, but also serve different functions, needs, and sometimes customers. Instead of comparing what each platform offers, we’ve set about contrasting the actual users who are already being served. In doing so, we’ve demonstrated StatSocial’s ability to provide the most in-depth customer insights available on the market today.
Check out the piece below to discover key differences across not only basic demographics, but also top brand and media affinities, influencers, personality traits, and Digital Tribes.
A Brief Summary of HubSpot and Salesforce
Salesforce is the king of the CRM mountain, and the fastest growing company in the sector, in terms of revenue. Their name has become a bit of a genericized trademark along the lines of Band-Aid or Kleenex.
HubSpot has quickly become the next most uttered name in the CRM discussion, having carved out a niche for themselves by serving the needs of smaller and/or younger businesses and sales teams.
HubSpot offers a surprisingly robust, free version of their platform. Easy to use, and minimally disruptive to a team’s existing workflow. HubSpot is ideal for those new to CRM, and/or those who feel underserved by their current systems and are looking to branch out.
HubSpot does, however, offer expanded, premium versions of their platform’s features. Contrasting with Salesforce’s annual subscription packages, HubSpot employs a feature-by-feature, cafeteria-style pricing model.
An Explanation of the Insights Below:
The index scores in this entry (the numbers styled as 0.00x in the charts) quantify the extent to which the corresponding percentage is in excess of, is in line with, or falls short of the baseline.
For this study, the baseline is the average degree to which a piece of demographic info, an affinity, a habit, a personality trait, a fondness for a work of media/media property, or membership in a Digital Tribe is detectable among the entirety of Americans online.
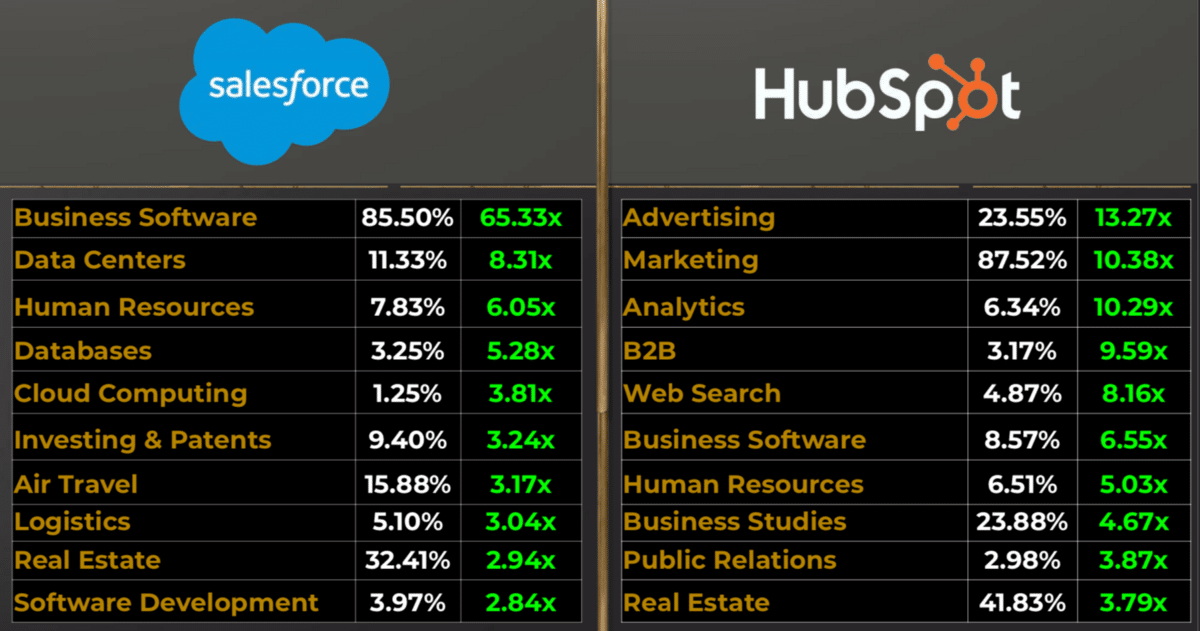
By looking at the strongest interests among Salesforce’s and HubSpot’s most dedicated customers, one begins to detect that each platform more commonly lands within the purview of different departments.
While each platform can count those with an interest in both technological and explicitly business-related matters among their top customers, the audiences decidedly lean one way or the other.
The top general interests among HubSpot’s customers are advertising and marketing. The former is an interest identified among 23.55% of their users, a quantity exceeding the baseline by 13.27 times. Marketing is an interest shared by 87.52% of their customers, which exceeds the baseline by 10.38 times.
Reflective of the oft celebrated ease with which the platform can be used, control of HubSpot — within the workplaces of what our insights reveal to be a large number of their users — seems to very possibly rest in the hands of the non-I.T. staff. Being a CRM tool, naturally that most often would be those who work in sales and marketing.
As HubSpot is concerned with inbound marketing, lead generation, and sales, and is designed to be quickly adopted in a hassle-free way, it stands to reason that its most ardent stans are not those up to their elbows in software, systems, and code.
While an interest in business software is detectable among both groups of customers — as no do
ubt it would be — it is far and away the most dominant interest among the Salesforce audience. That interest is evident in over 85% of their users, a quantity exceeding our baseline by 65.33 times. Add to that the facts that their second most prominent interest is in data centers (a concern detectable among 11.33% of the group, a quantity exceeding our baseline by 8.31 times), and that cloud computing occupies the thoughts of a segment 3 ⅘ times greater than what you find when looking at the entirety of Americans online, and, well…
Let’s just say that we find ourselves resisting the temptation to portray this as a “jocks vs. the nerds” type scenario. We’ve sworn, however, to forgo any and all such metaphors unless and until “rockers vs. the mods” can reasonably be used. Clearly, that is not the case yet.
In truth, though, Salesforce is a considerably more sophisticated platform with a whole battery of functions, potentially extending into all areas of an enterprise. Conversely, HubSpot have positioned their platform as being easy enough to use that a company with no I.T. department of which to speak could still hit the ground running, using it in no time.
BOTH platforms are used by sales and marketing, as should go without saying, and our findings do support this. But there’s a fair bit more know-how required to get the most out of Salesforce. It stands to reason that the common concerns of those who work both with and in I.T. (i.e., those matters of a more techie nature) would rise to the top.
Behold the general interest numbers in chart form:
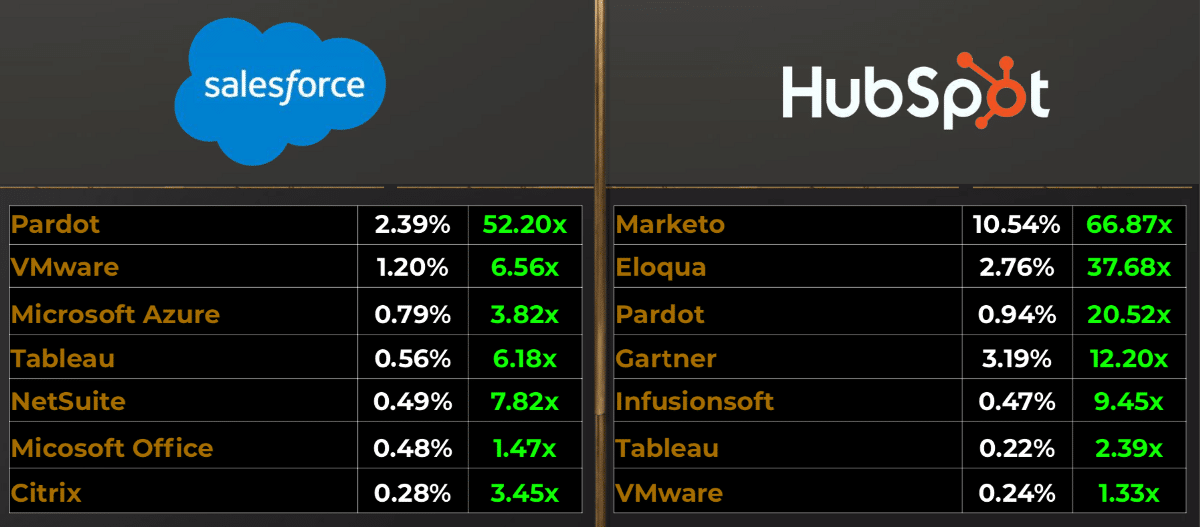
HubSpot’s usefulness as a free, or inexpensive, enhancement to other marketing automation and management platforms is directly reflected in their users’ favorite business software brands.
Marketo, and their toolkit of “complete Engagement Marketing Solutions” ranks highest of all business softwares favored by HubSpot’s customers. A quite significant 10.54% of their customer-base also belongs to that of Marketo. This percentage exceeds the baseline by a rather dramatic 66.87 times.
Oracle’s marketing automation platform, Eloqua is also a favorite among the HubSpot crowd, with the portion of their audience adopting the service exceeding the baseline by 37.68 times.
Salesforce’s customers, on the other hand, prefer to keep their solutions close-to-home before looking elsewhere.
HubSpot integrates easily and well with Salesforce, and provides an affordable means of enhancing the latter’s features. But the business software most dramatically finding favor among Salesforce’s users is the company’s own Pardot. The segment of their audience who identifies as using their homegrown marketing automation platform exceeds the baseline by 52.20 times.
Dipping a fair bit in terms of the degree to which it over-indexes against our baseline is the second most favored business software among Salesforce’s customers, the Dell Technologies owned, cloud computing, virtualization platform, VMware. Its users can be found among the CRM giant’s customers to a degree exceeding the baseline by 6.56 times.
For quick and easy reference, here are the business software affinity stats for these audiences, displayed graphically.
Those marketing mods of HubSpot, once more, face off against the rockers of Salesforce.
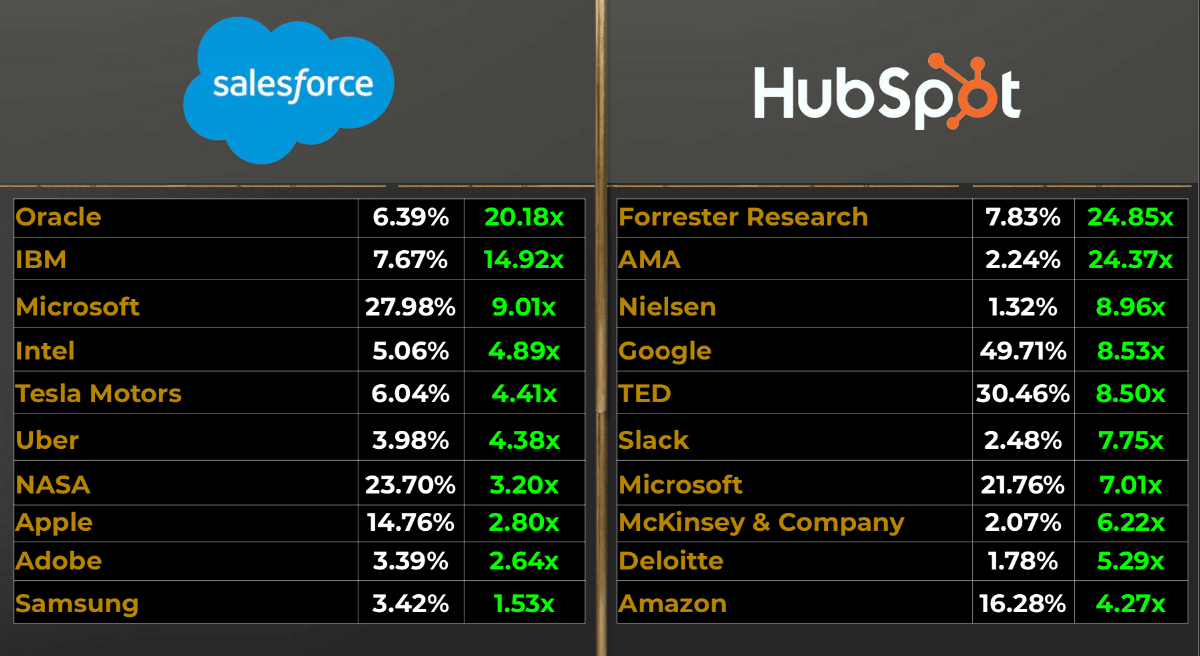
By looking at the non-business-software brands rating most highly with the customers of each platform, a tale as old as — well, at least as old as the start of this entry, but truthfully quite a bit older than that — again reveals itself.
Tech-oriented market research firm, Forrester Research, can boast that 7.83% of HubSpot’s crowd are their customers & readers (a proportion 24.85 times greater than what’s found when observing U.S. netizens as a whole). Even more telling, the industry best-practices oriented, American Marketing Association, finds enthusiasts among this crowd to an extent 24.37 times in excess of our baseline.
And those techie types, maintaining and applying Salesforce’s considerable capabilities to the needs of their workplaces, make themselves quite known when observing their favorite non-business-software brands.
The top brands with the Salesforce bunch is a bit of a who’s who of tech-giants: Oracle, IBM,Microsoft, and Intel all pop up. But check it out for yourselves below.
Explanation: 2.24% of HubSpot’s customers are members of the American Marketing Association (the AMA named above), this quantity exceeds what you’d find among American internet users as a whole, by 24.37 times.
Statistics are unconcerned with your — or our — narratives. Alas, if only anything could be so neatly summarized as the jocks and nerds of popular fiction.
On the other hand, when perusing the popular media consumed by these groups, one side of this equation does still present a bit more, shall we say, cerebral.
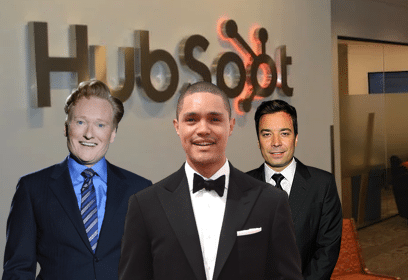
The movers and shakers populating HubSpot’s gang of most dedicated customers enjoy their television, primarily, as it exists later in the evening (perhaps after a hard day at work, selling stuff, using HubSpot all the while).
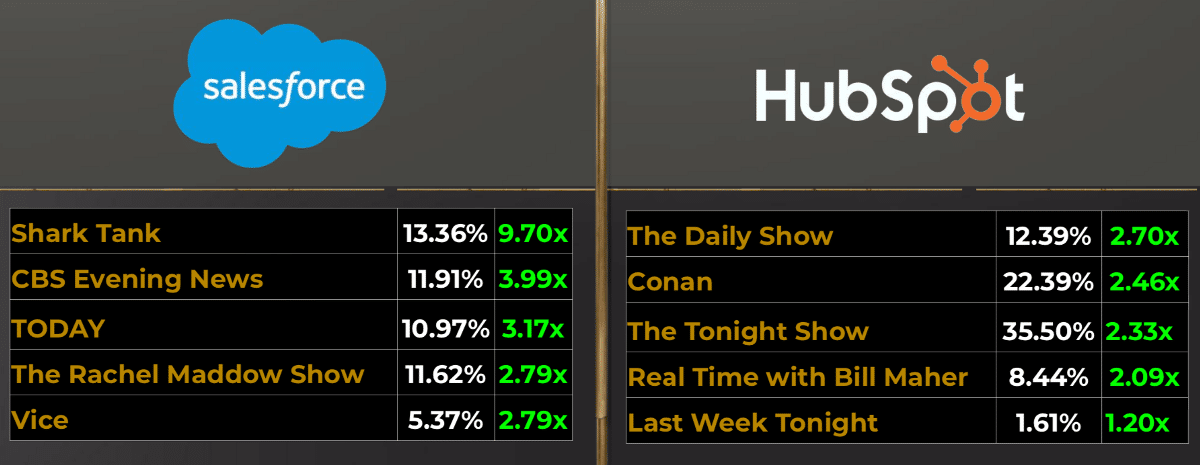
Of TV’s offerings, Comedy Central’s ‘The Daily Show with Trevor Noah’ is most prominent here, appealing to 12.39% of HubSpot’s users (a quantity exceeding the baseline by 2.70 times). Next on their list are ‘Conan,’ and ‘The Tonight Show Starring Jimmy Fallon.’
The true nature of this group, though, shines through brightly upon noticing that the top podcast with this audience, Social Media Examiner’s ‘Social Media Marketing Podcast.’ It counts 2.85% of HubSpot’s customers as listeners, a quantity that exceeds our baseline by a considerable 15.98 times.
Venturing over to YouTube: the Charisma on Command channel shares with viewers analytical breakdowns of various figures from current events and popular media. The channel provides analysis and insight into what it is that makes these figures charismatic, or conversely where they’ve not quite adequately accessed their powers to attract and influence (matters of natural interest to those in sales and marketing). It is viewed by a portion of HubSpot’s audience that exceeds the baseline by 18.03 times.
“But what,” you may be asking, “of Salesforce’s customers?”
And you’re right to ask.
The top TV programs with the Salesforce crew are not, as lists featured in this entry up until now might suggest, explicitly tech related. They are, more so than not, at least in the upper reaches of their list, news programs. Big news broadcasts, some with roots extending nearly all the way back to the birth of the medium: ‘CBS Evening News,’ of which 11.91% of Salesforce’s customers are viewers, a segment size 3.99 times greater than what you’d find among the U.S. online audience. 10.97% of this audience — a percentage exceeding the baseline by 3.17 times — regularly tunes into NBC’s eternal ‘TODAY.’
The ‘Shark Tank’ gang.
The top TV show, however, is arguably lighter fare, but also a bit more blatantly concerned with matters of a business nature. American TV’s monument to the entrepreneurial spirit, ‘Shark Tank,’ is the number one show with this gang. Having recently wrapped its 10th season, the show is a favorite with 13.36% of the Salesforce audience. This quantity exceeds the U.S. average by 9.70 times our baseline.
The highest ranking media here continues to drift a bit from the I.T. orientation of some categories outlined above, and instead — particularly when it comes to favorite podcasts — sticks closely to the first syllable of the platform’s name. ‘The Brutal Truth About Sales & Selling’ is a podcast that caters to the “2B Social SaaStr Cold Calling SaaS Salesman Advanced Hacker” listener. The group of the Salesforce customer-base that are its fans are 6.77 times larger than what you’d find among the average U.S. online audience.
YouTube’s ‘The School of Life,’ a 4.7 million subscriber “channel devoted to self-knowledge and fulfillment” is the favorite on the platform among this audience. It finds fans here to a degree greater than the baseline by 4.46 times.
And the top 5 TV shows with each audience are…
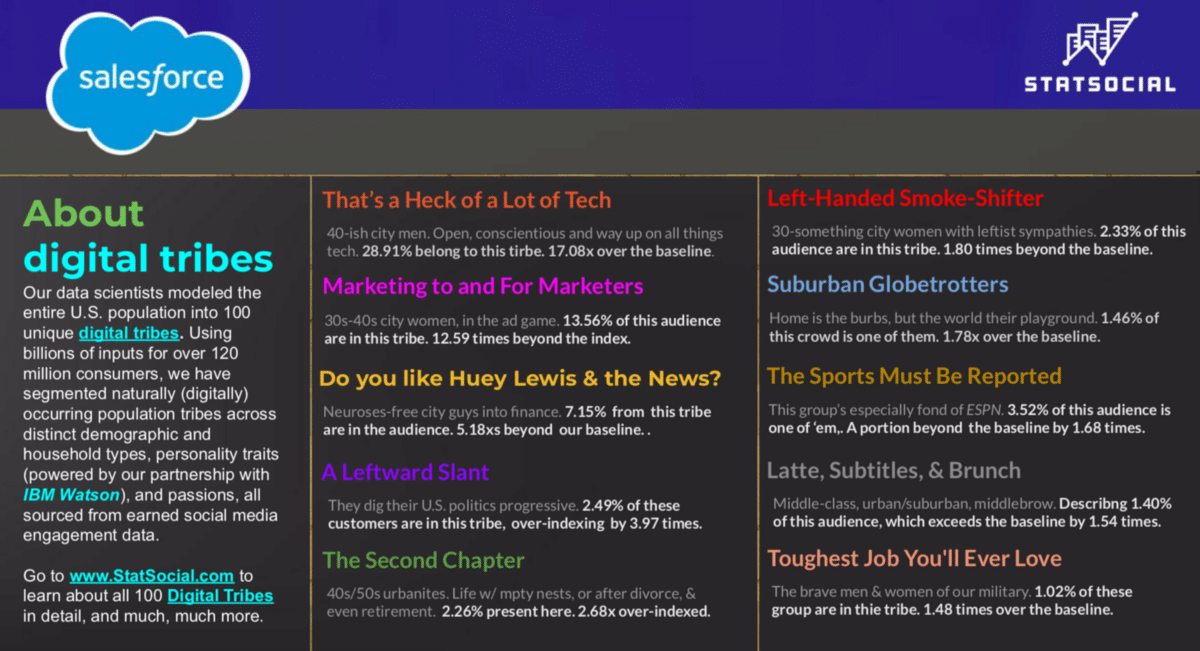
When looking in to which of our Digital Tribes the members of each platform’s customer-base belongs, and in what proportions, nothing arises which dispels a “sales and marketing to the HubSpot side, and techies to the Salesforce” type narrative.
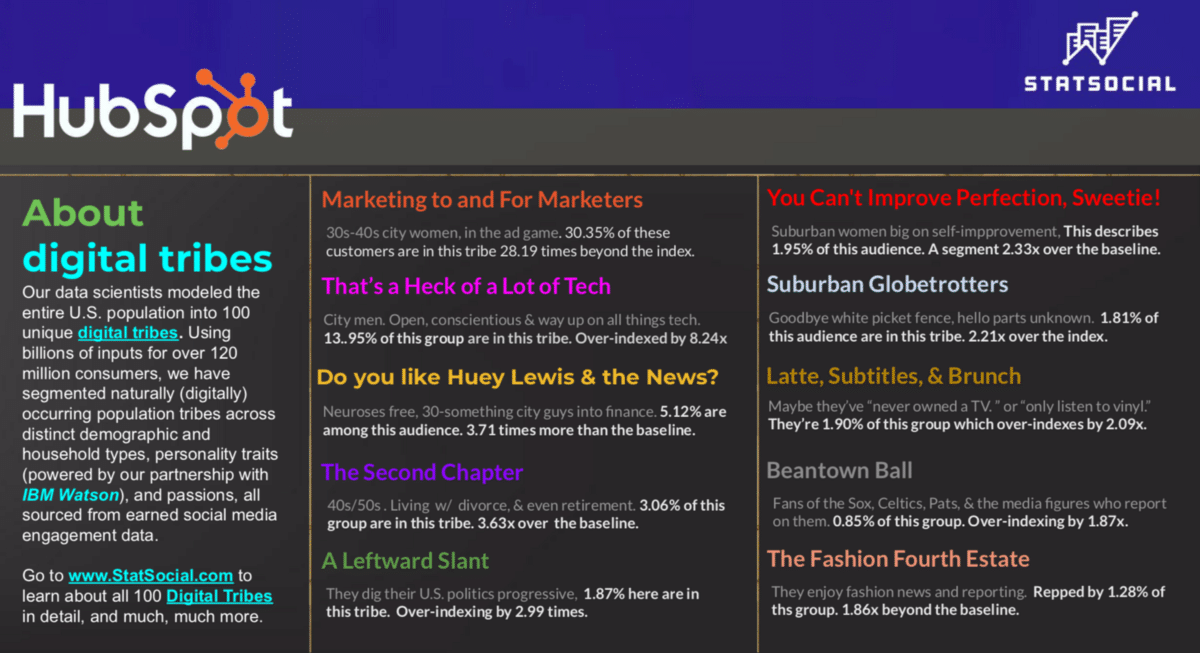
StatSocial Digital Tribes is a model of the U.S. population broken down into 100 distinct market segments (calculated by combining our demographic and affinity data with our Personality Insights® data; the latter powered by IBM Watson). Seeing which Tribes are present, and in what proportions, grants our users quick, crucial, and unprecedented insight into the humans who make up a given audience.
You can read more in depth descriptions of the Tribes mentioned below here, and you can read a blog entry going into the whole Digital Tribes matter a great deal more in-depth here.
The graphics below show the 10 best represented Tribes among each of the audiences being explored. An ever-so-pithy summary of the shared affinities, demographics, and/or personalities of each tribe is then provided. But again, we recommend you check out the more in-depth (albeit still brief) descriptions here, where you’ll find descriptions of the other Digital Tribes as well.
The comparisons above say as much about who is within each of these groups of customers as any featured in this entry. These are, of course, the top, most over-indexed results. Deeper digging — and please reach out to us for a demo, so we can show you just what that might entail — will reveal only finer detail, and reveal all the more subtle differences between the two groups.
Both platforms central to the workdays of those in sales and marketing, as well as those in I.T., and other tech-related positions within a company. The platform designed to be most easy-to-use and quick-to-adopt finds non-tech-sorts — or, more accurately interests and affinities — the most prominent among its audience. Conversely, the more robust, sophisticated, and all-encompassing platform requires I.T. for maintenance, scaling, customizing, and integration, with its fullest potential being realized by tech savvy sales and marketing sorts.
Most immediately telling — and of course confirming the basic narrative set out from the start — is that the Digital Tribe best represented among HubSpot’s customers is “Marketing to and For Marketers” (the name being rather self-explanatory), and the second most prominent is “That’s a Heck of a Lot of Tech” (same).
And of course, among the Salesforce crowd, the top two most prominent tribes are flipped.
BONUS
Usually we open with demographics, but here they make a nice epilogue.
While very important, and the bear minimum of what any reasonable customer would expect from an analytics platform such as ours, for the purposes of this entry, they weren’t necessary for demonstrating our ability to reveal the differences between audiences many would assume to be more or less statistically the same.
But you do want to know the demographics, right? Well, here they are:
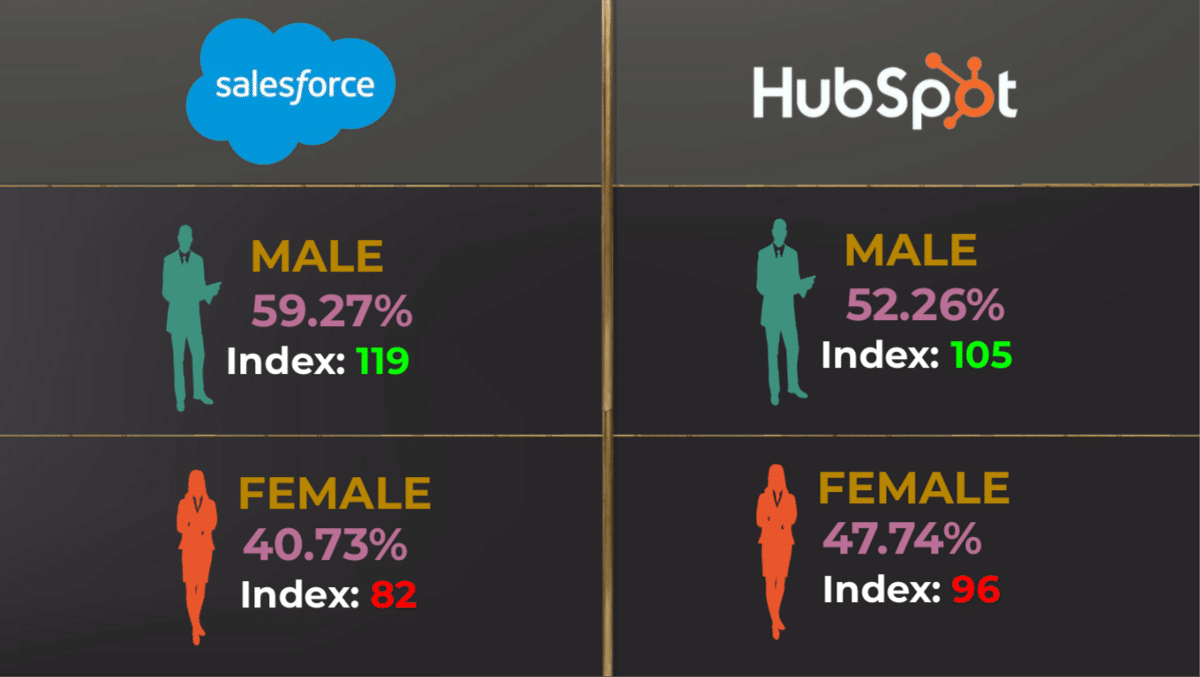
GENDER
Explanation: 59.27% of Salesforce’s customer-base is male. That percentage exceeds the baseline by 1.19 times. 52.26% of HubSpot’s audience are male, a quantity exceeding the full American online population by 1.05 times.
The gender split among the HubSpot audience being much closer to even is unsurprising, if the interpretations of the data up to this point have been accurate. Without involving ourselves in the greater discussion (except to say that there’s no reason for there to not be as many women as men in every field, and at every level; an opinion of ours we hope would be taken for granted), it is rather well-accepted that, whatever the reasons, women are historically under represented in I.T. roles, whereas they are some of the biggest names in sales and marketing.
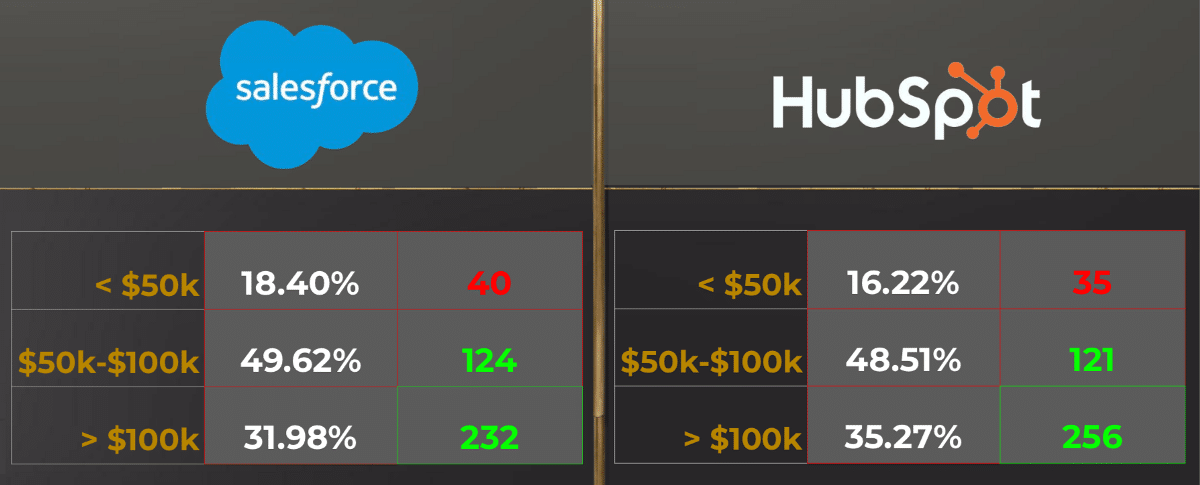
INCOME
In an overall way, these are two audiences who both earn extremely well, with over a third of the HubSpot audience earning over 100k a year. These are the kinds of customer statistics any enterprise platform would be pleased to see.
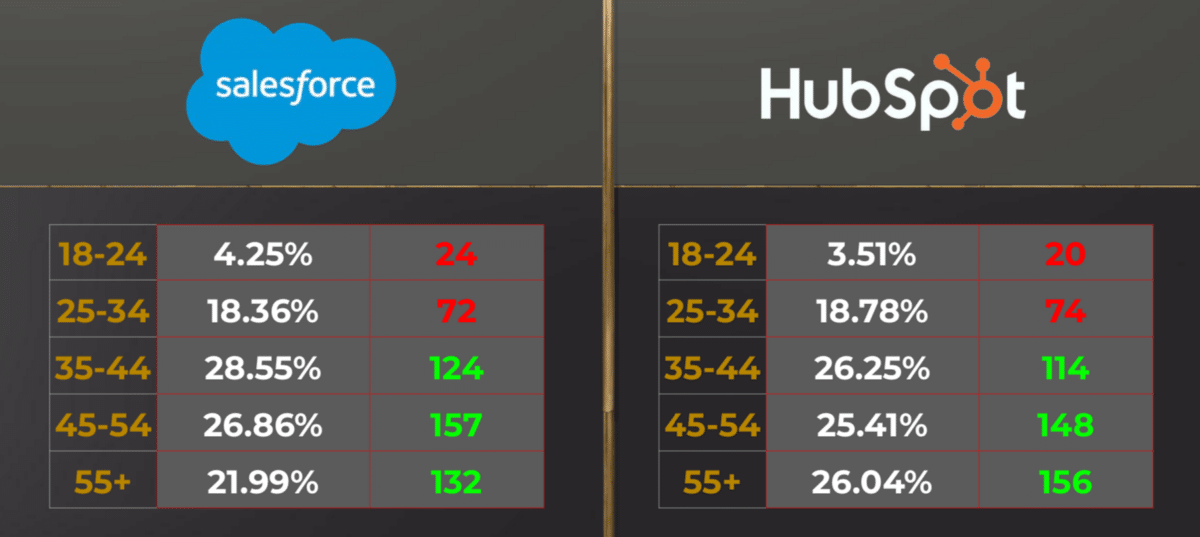
Both of these audiences skew older in comparison to our baseline of the entire U.S. online population. Those over age 55 are impressively well-represented, and account for over a quarter of HubSpot’s audience.
While the under-34 set fall below the baseline, they do still account for over one-fifth of each group of customers.
Insights on top of insights can be found by the curious reader who chooses to poke around the StatSocial blog here. Peruse the many entries, offering all kinds of insights, studies, and deep dives to better acquaint you with the capabilities of StatSocial.
We use cookies on our website to give you the most relevant experience by remembering your preferences and repeat visits. By clicking “Accept All”, you consent to the use of ALL the cookies. However, you may visit "Cookie Settings" to provide a controlled consent.
This website uses cookies to improve your experience while you navigate through the website. Out of these, the cookies that are categorized as necessary are stored on your browser as they are essential for the working of basic functionalities of the website. We also use third-party cookies that help us analyze and understand how you use this website. These cookies will be stored in your browser only with your consent. You also have the option to opt-out of these cookies. But opting out of some of these cookies may affect your browsing experience.
Necessary cookies are absolutely essential for the website to function properly. These cookies ensure basic functionalities and security features of the website, anonymously.
Cookie
Duration
Description
cookielawinfo-checkbox-analytics
11 months
This cookie is set by GDPR Cookie Consent plugin. The cookie is used to store the user consent for the cookies in the category "Analytics".
cookielawinfo-checkbox-functional
11 months
The cookie is set by GDPR cookie consent to record the user consent for the cookies in the category "Functional".
cookielawinfo-checkbox-necessary
11 months
This cookie is set by GDPR Cookie Consent plugin. The cookies is used to store the user consent for the cookies in the category "Necessary".
cookielawinfo-checkbox-others
11 months
This cookie is set by GDPR Cookie Consent plugin. The cookie is used to store the user consent for the cookies in the category "Other.
cookielawinfo-checkbox-performance
11 months
This cookie is set by GDPR Cookie Consent plugin. The cookie is used to store the user consent for the cookies in the category "Performance".
viewed_cookie_policy
11 months
The cookie is set by the GDPR Cookie Consent plugin and is used to store whether or not user has consented to the use of cookies. It does not store any personal data.
Functional cookies help to perform certain functionalities like sharing the content of the website on social media platforms, collect feedbacks, and other third-party features.
Performance cookies are used to understand and analyze the key performance indexes of the website which helps in delivering a better user experience for the visitors.
Analytical cookies are used to understand how visitors interact with the website. These cookies help provide information on metrics the number of visitors, bounce rate, traffic source, etc.
Advertisement cookies are used to provide visitors with relevant ads and marketing campaigns. These cookies track visitors across websites and collect information to provide customized ads.