StatSocial’s Silhouette is the industry’s most advanced audience intelligence platform, and a vital component of any comprehensive market research initiative. Integrating our data to your research panel unlocks tremendous opportunities. Below is a high level example of what’s possible.
In brief, researchers can:
Save time and money selecting panels based on thousands of descriptive attributes to build a custom list – matching identities between a social data set and your preferred panel provider.
Supplement and amplify the insights gained from your panel by leveraging Silhouette’s 85K insights
StatSocial appends and segments many key data-points related to a panel’s members, such as personas, personality traits, the influencers who have captured their attention, memberships, and media and brand affinities. We also report a number of key B2B findings, such as job titles and industries, social media network participation, demographics, and more. Our ability to append and select data spans survey channels – social handles, emails, and other offline identifiers.
For this example, we analyzed a panel that was selected based on their receptiveness to advertising. Using Silhouette, we were able to match that panel to overlay nearly 85K insights. Below is a sample of some insights, unique to StatSocial, that we found especially interesting.
See below to understand how people who are more receptive to advertising index against Social Network Platforms, News Media, Syndicated TV Shows, Political Websites, and Personality Traits.
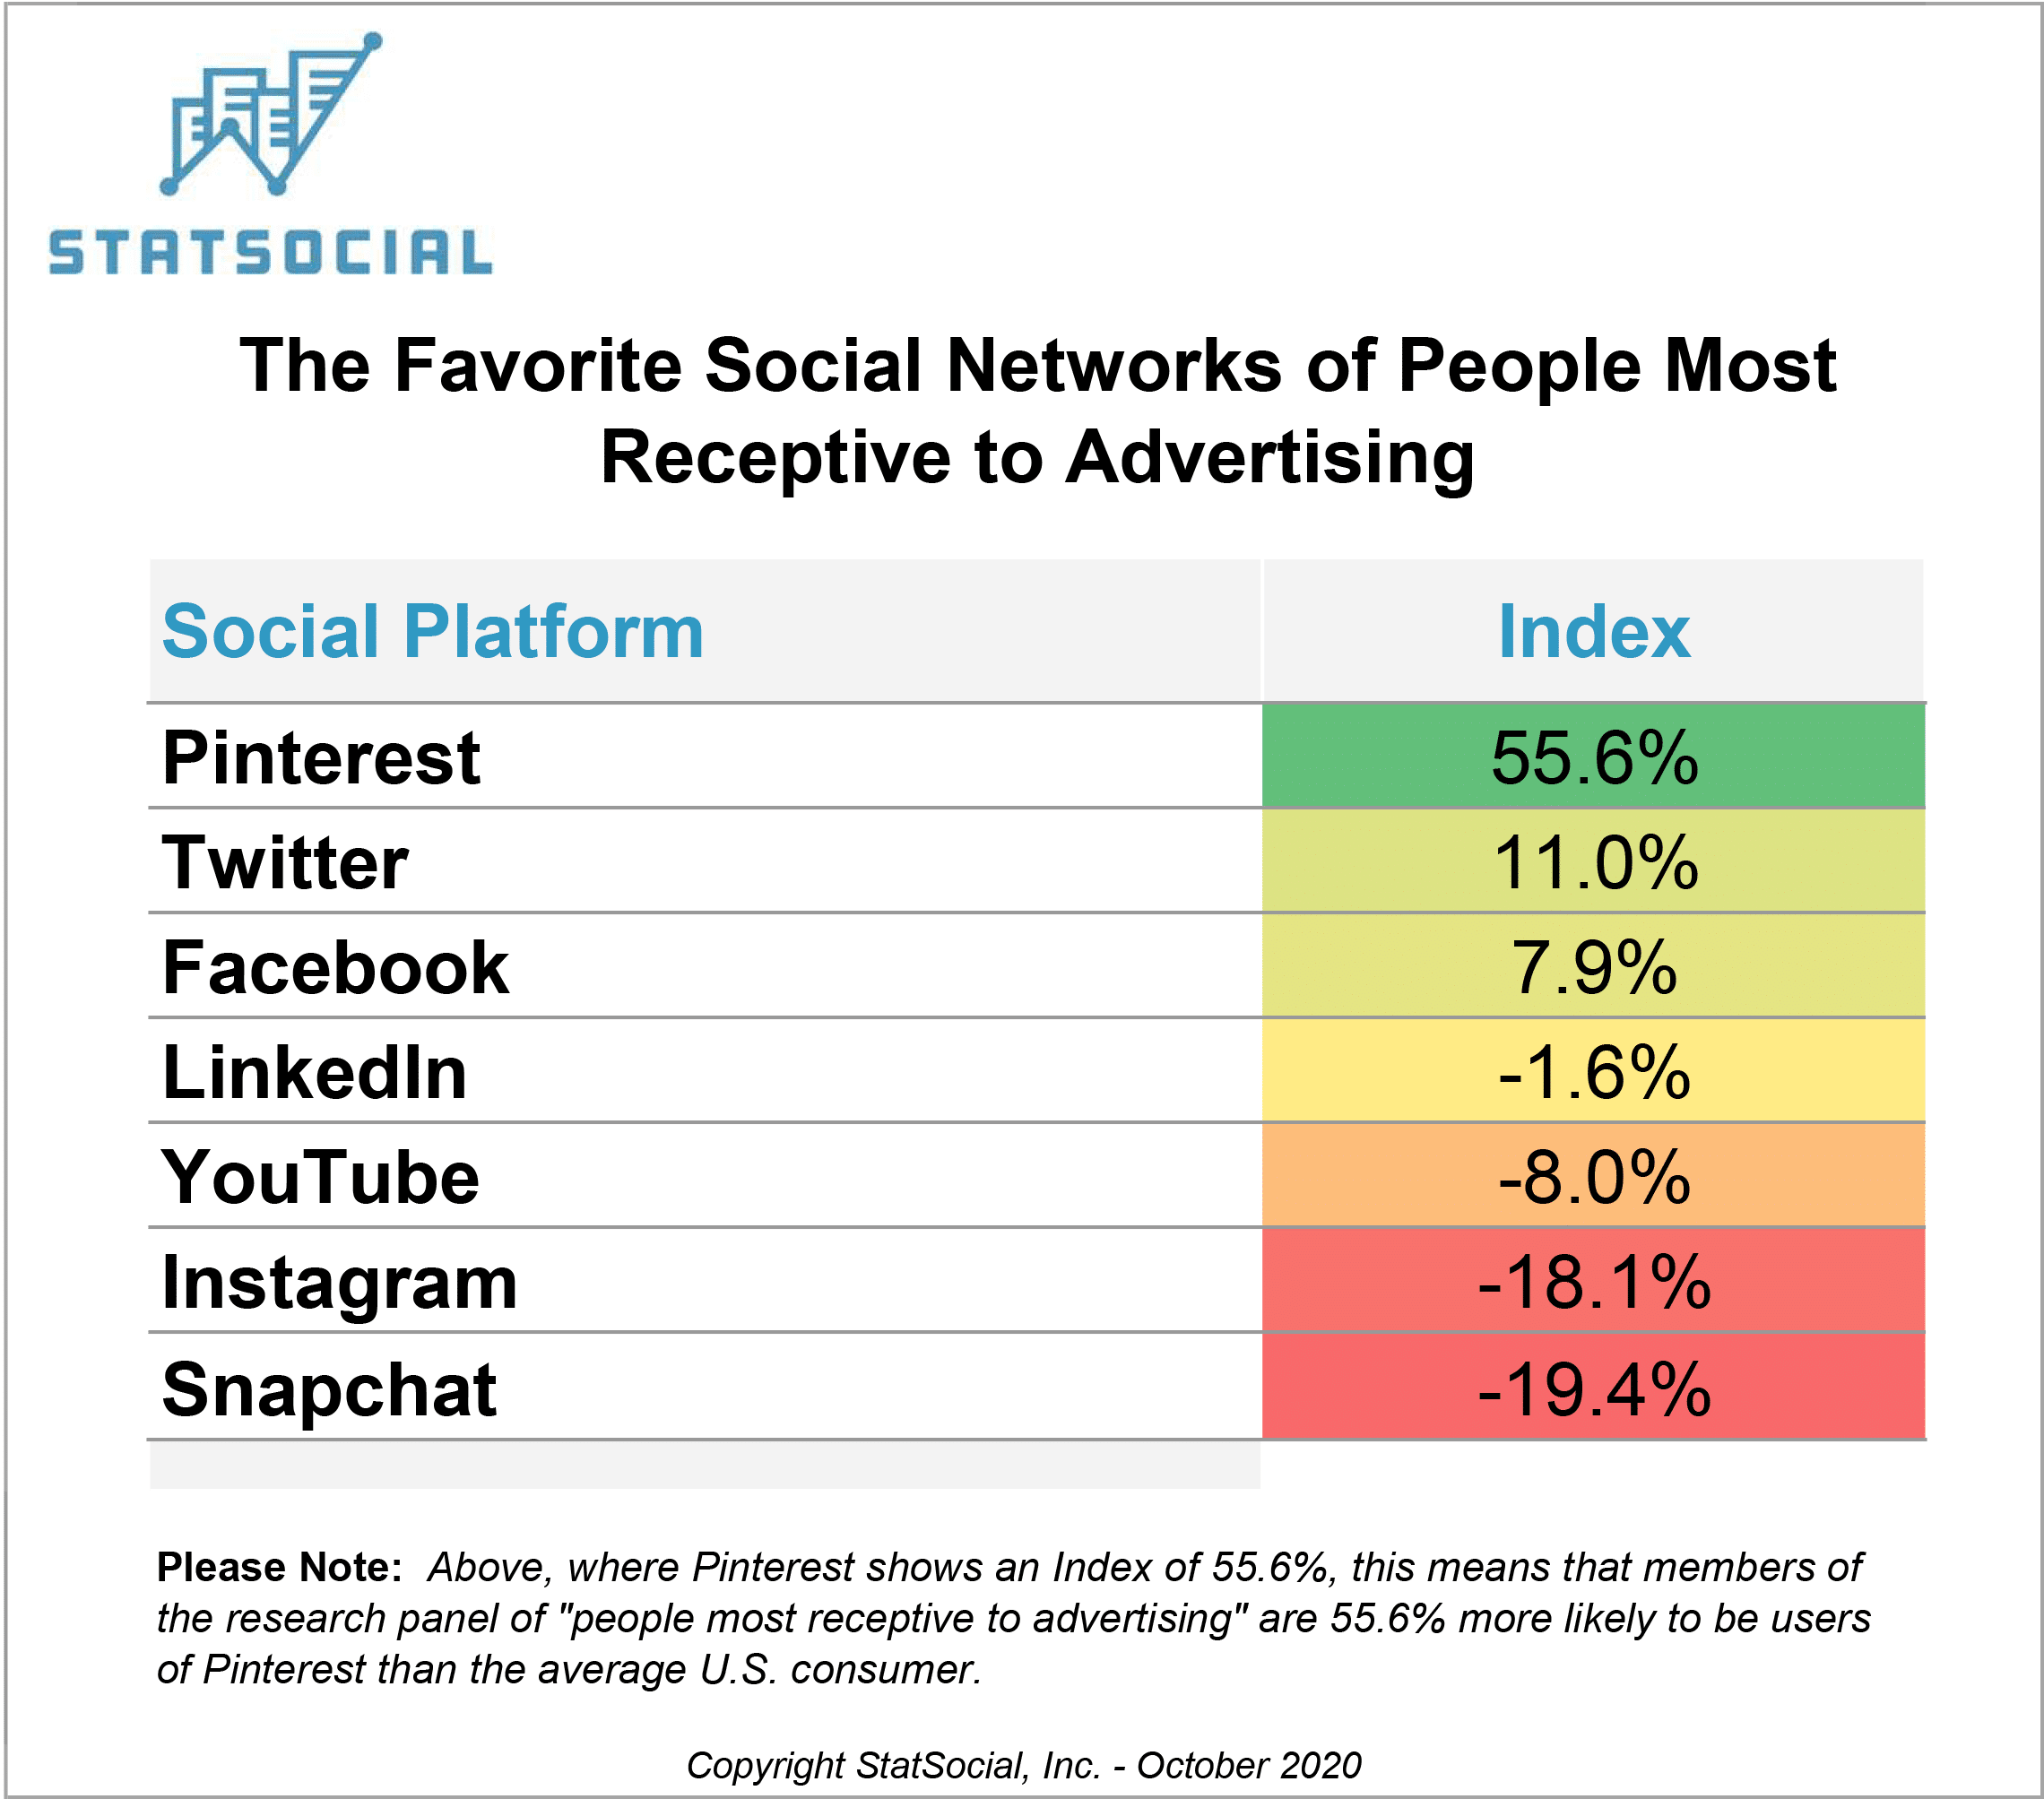
Social Network Users Most Receptive to Advertising
Pinterest is, for many users, and at least partially by design, an important destination on the road to making purchases. Pinners often use their boards as aspirational aids, and they help them to visualize and research which goods and services will most ideally suit their wants and needs. It makes perfect sense, then, that those most receptive to advertising are 55.6% more likely than the average U.S. consumer to be one of Pinterest‘s members.
Facebook has 190 million U.S. users, and Twitter 48.4 million. It is significant that people most receptive to advertising are nearly 8% and 11% (respectively) more likely to use these platforms. Particularly as advertisers annually spend millions, or even hundreds of millions, of dollars trying to reach the users of each.
It’s not too surprising that Snapchat and Instagram have users, that on average, are not as receptive to advertising. The users skew younger and digitally inclined. It’s not too far a stretch to believe that coming of age in the digital era has, to a degree, desensitized them to advertising.
——————————————————————————————
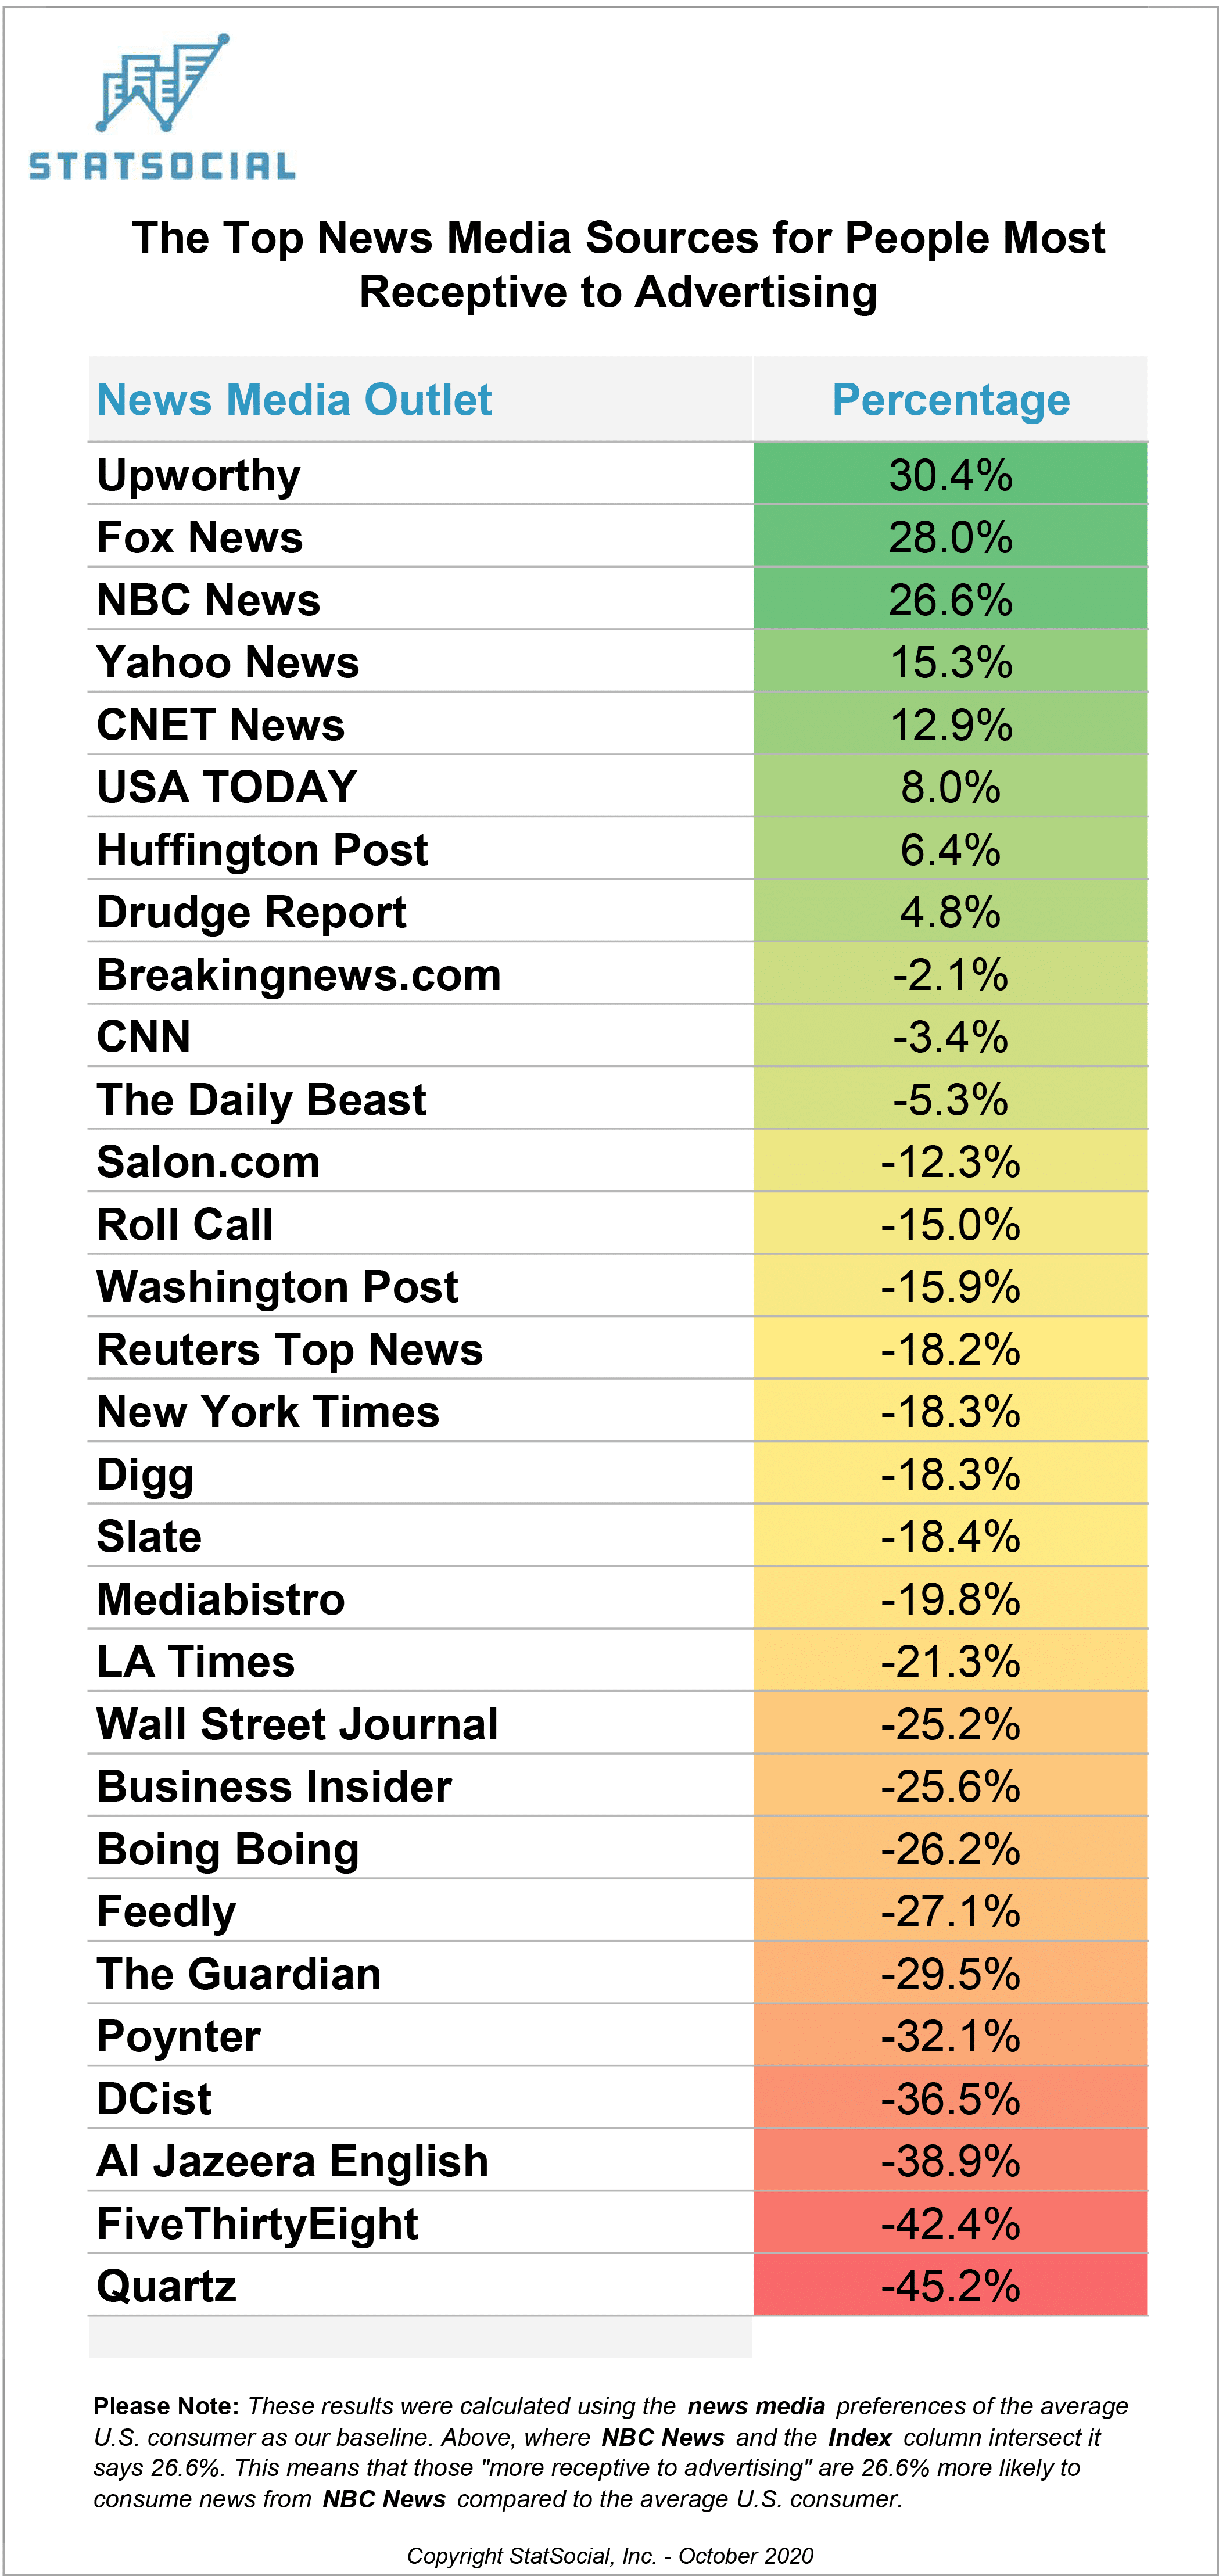
News Media Outlets With Audiences Most Receptive to Advertising
Liberal/progressive-politics oriented news website, Upworthy, edges out all other news sources on this chart. The population solicited for this panel is 30.4% more likely than the average U.S. consumer to visit the site routinely.
Shifting perspectives, those of the “receptive to advertising” class are 28% more likely than the average to turn to the famously conservative, Fox News, to keep up with current events. The advertising-receptive actually under-index when it comes to engaging with CNN.
Much of what the news reports is going to naturally be political. But moving on from news reported with a political slant, a bit later in the entry we will consider outlets for whom politics is the whole point.
——————————————————————————————
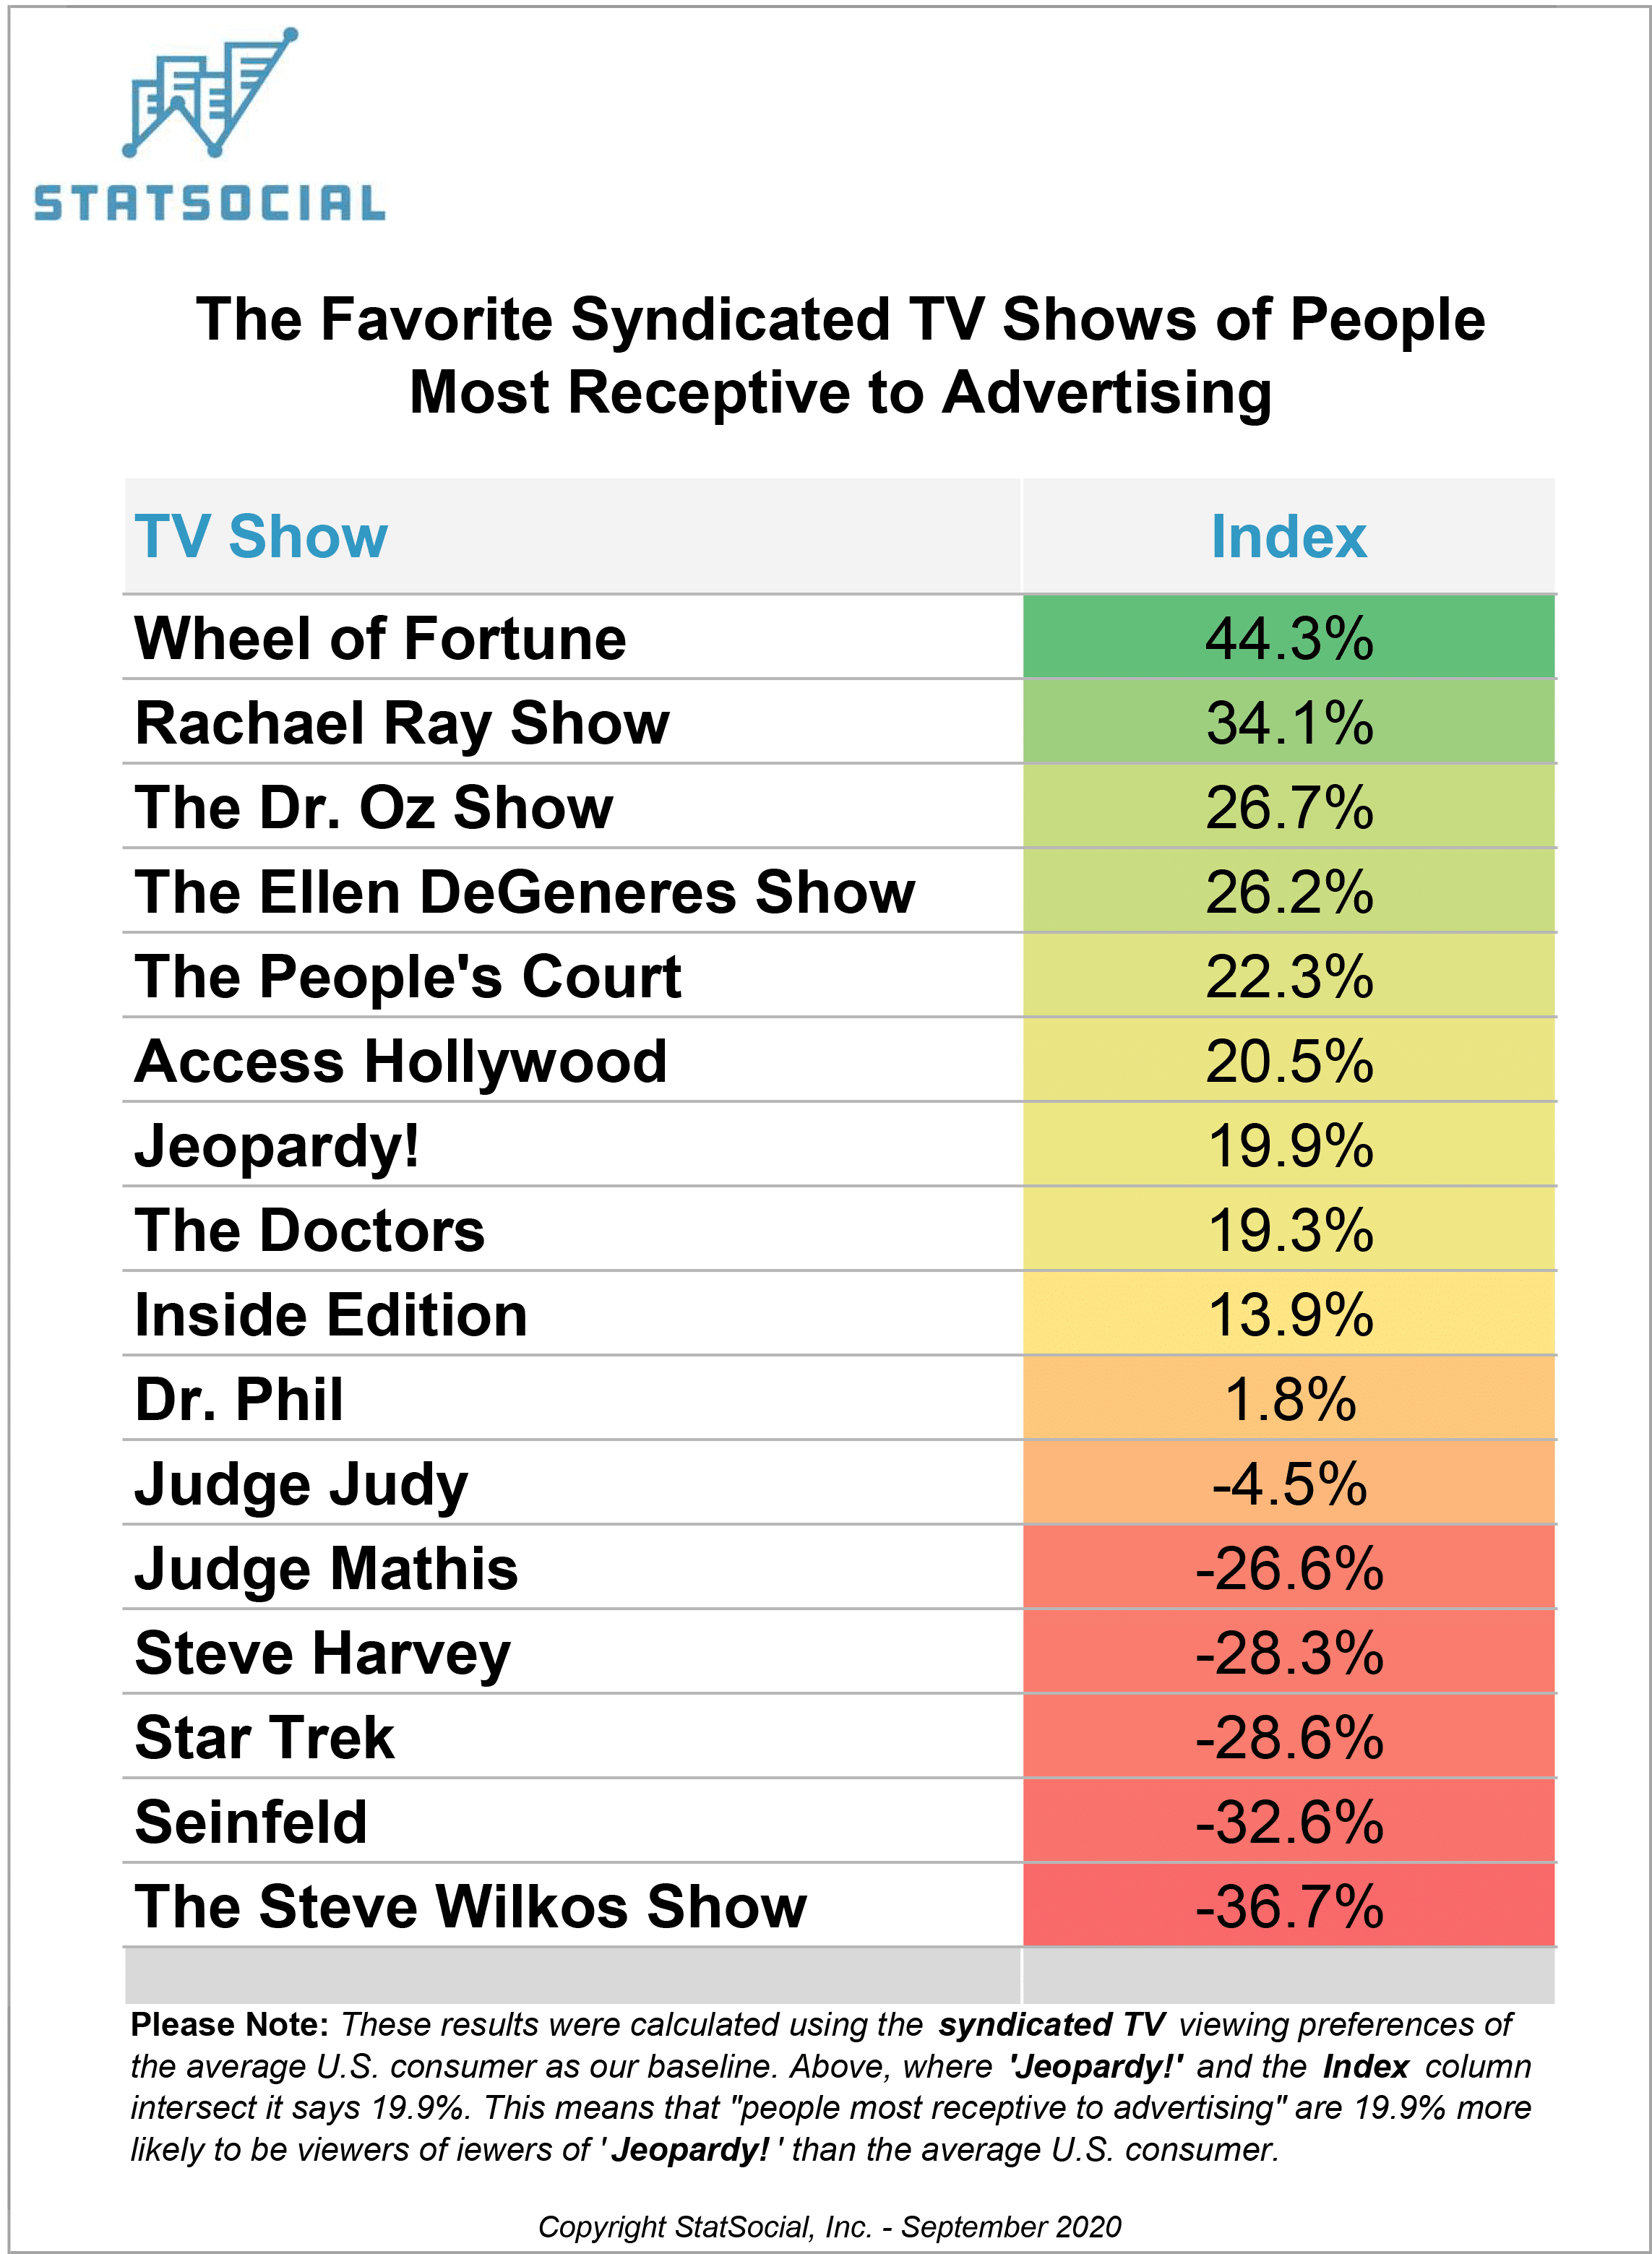
Favorite Syndicated TV Shows for People Most Receptive to Advertising
StatSocial analyzes audiences for more than 2,000 TV shows, grouping them by network and genre. For this analysis, we looked at a group of Syndicated TV shows, with ad time that is normally more economical, and customizable by region, than what a major network traditionally offers. Knowing which of these shows boasts a viewership that is statistically more likely to be receptive to a brand’s message is terrifically valuable data for media planners. Ron Popeil didn’t, after all, make his millions from advertising during the Super Bowl.
Looking at this chart we see, right up top, the longest-running syndicated game show of all time (in the U.S.), which is about 38 seasons, or so, into its run. ‘Wheel of Fortune’ fans are 44.3% more likely to be most receptive to advertising than the average US consumer.
As wasreported by Quartz in 2016, political advertisements have been quite lucrative for the syndicated stalwart. The show is primarily viewed by those ages 65 and up, and is said to have TV’s oldest viewership. This is a famously motivated voting bloc, but this is not the only advertising that could be received well by their audience.
StatSocial has a treasure trove of insights to share regarding the viewers of ‘Wheel of Fortune’ (as well as every other show on this list, and every other item in this entry).
——————————————————————————————
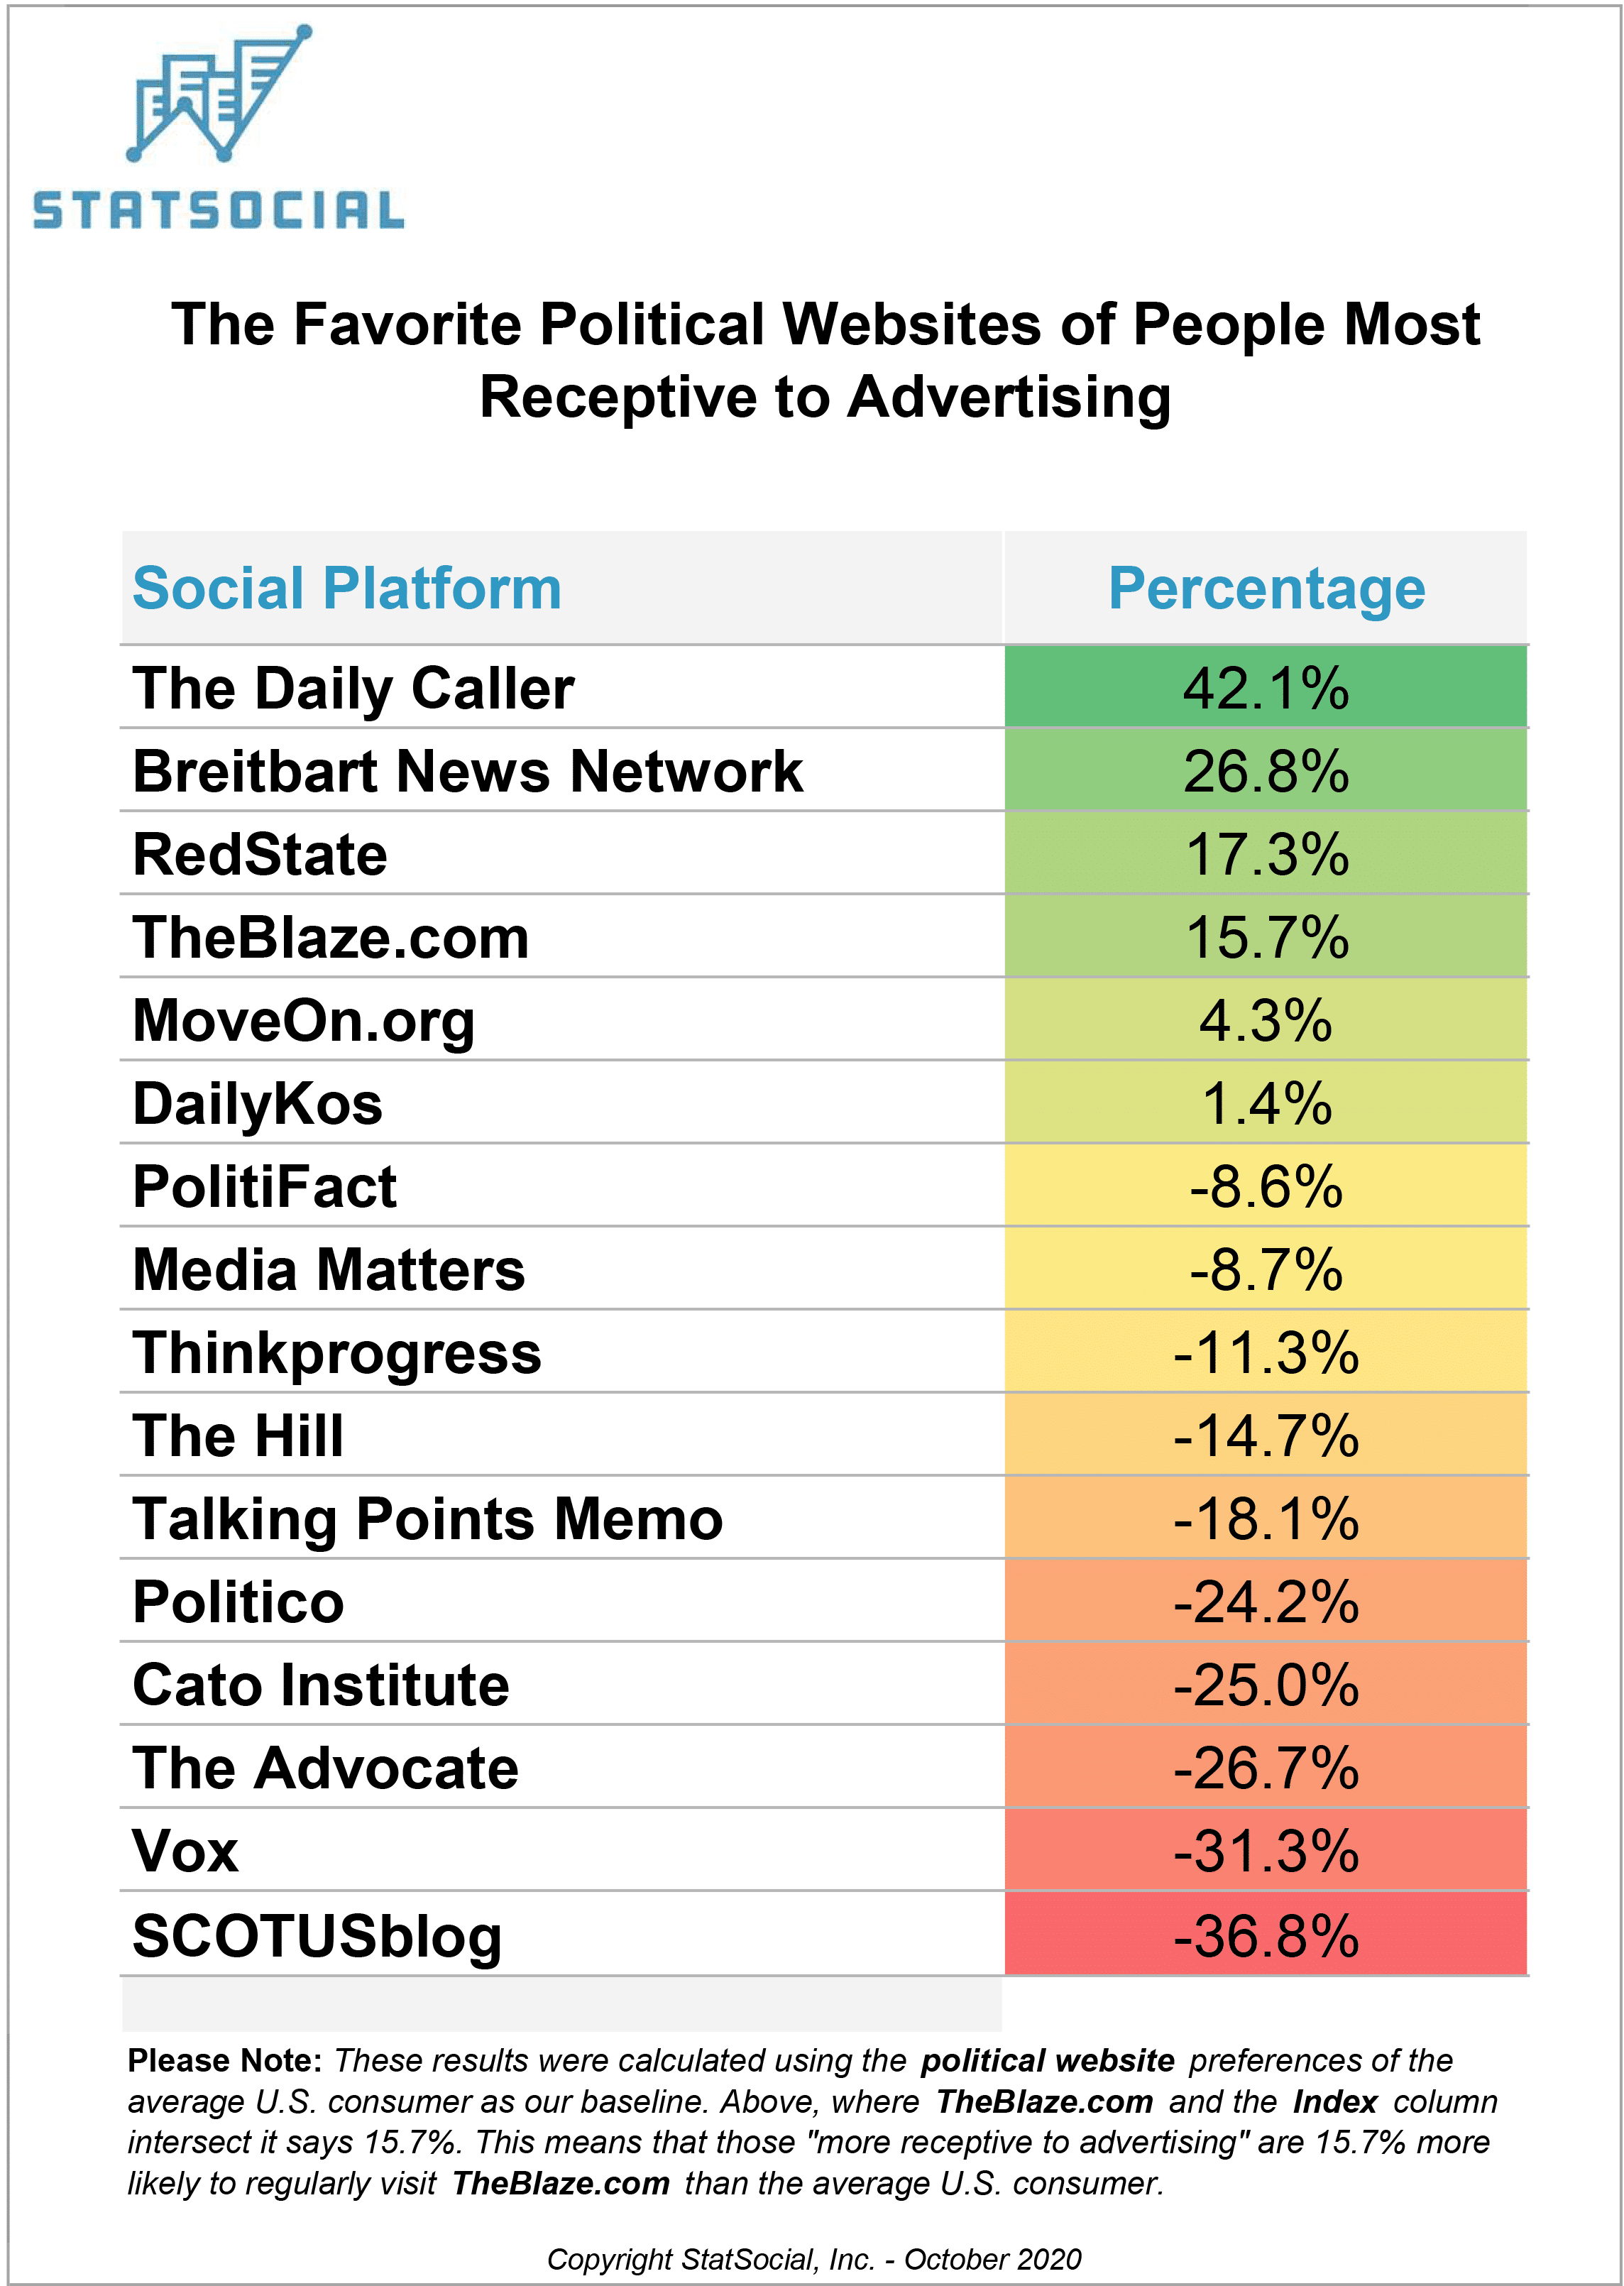
Political Websites Read by People Most Receptive to Advertising
Politics may be a topic best avoided in mixed company. It has long been the impetus for much in the way of advertising and marketing innovation, birthing many widely-adopted and highly-effective approaches. It is also an area of popular media where many pairs of engaged eyes will be focused, as it touches most of our lives.
The Tucker Carlson co-founded, The Daily Caller, is the most prominent site here. With the ad-receptive 42.1% more likely to be routine visitors than the average consumers.
The remaining three of the top four most over-indexed sites also lean unambiguously to the right; Breitbart at 26.8%, RedState at 17.3%, and TheBlaze at 15.7%.
As these are explicitly political websites, and therefore of appeal to a specific type of audience, it’s always wisest to consider the full audience profile set before you. While learning slightly right, perhaps, on the whole the data paints a picture of a politically diverse group.
——————————————————————————————
Personality Traits of People Most Receptive to Advertising
One of the most unique sets of insights unique to StatSocial are the personality traits from IBM Watson™ and their Personality Insights service.
In psychology, the Big 5 personality traits describe a popularly-employed taxonomy that breaks down human personalities into five, broad, overarching categories. IBM Watson™ employs this model, and the five traits that give it its name — Openness, Conscientiousness, Extraversion, Agreeableness, and Neuroticism — as the umbrella categories under which numerous, more specific personality traits can be found.
——————————————————————————————
How It Works
INSIGHTS
When trying to convey the depth, breadth, and scale of StatSocial‘s Social Affinity and Earned Media data, we sum it up like this: Imagine an 85,000 question survey given out to 300 million consumers. Now, imagine this already incredible thing as a living, dynamic data set. This survey is being administered in real time, constantly, being continually refreshed to include all of the most up-to-date opinions, choices, affinities, and actions.Learn more here.
ATTRIBUTION
Marketers and media-sellers know that Earned Media and Influencer Marketing are valuable components of their campaigns. Attributing a definitive worth to either, however, has traditionally been elusive. As StatSocial’s analyses report of with topics and influencers an audience’s members have been engaging, a marketer can now directly attribute website and offline conversions.The same metrics that marketers have long relied upon to quantify the value of a campaign’s Paid and Owned Media components, are now just as readily available for Earned Media.Learn more here.
ACTIVATION
StatSocial‘s vast and comprehensive taxonomy is accessible across every programmatic platform. Our partnership with Liveramp, and direct integrations with such leading platforms as Viant, Oracle Data Cloud, Eyeota, and Lotame, finds StatSocial‘s insights available everywhere you access audience data.We are also available, via our 24/7 online to get you the insights and audiences you need, when you need them.Learn more here.
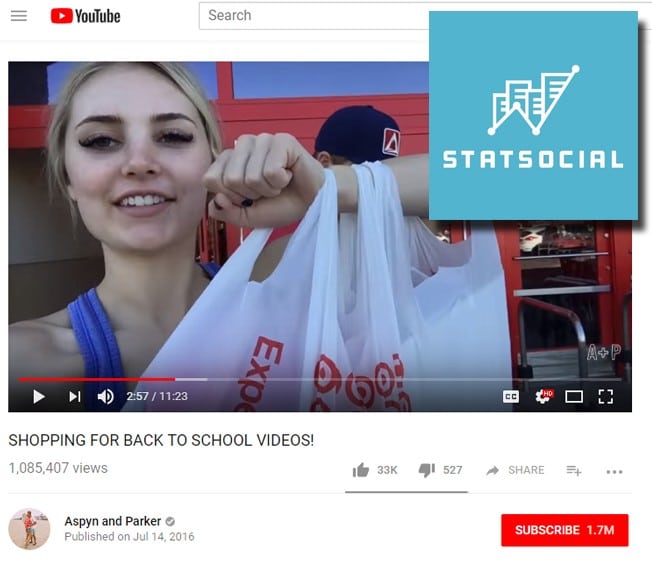
The month of August is here, which means that Back-to-School shopping season is peaking. Parents around the country are looking for the best deals for supplies and kid clothing, while companies are advertising heavily trying to reach its core audience during the annual Back-to-School frenzy. At StatSocial we recognize an opportunity when a social media trend correlates with an increase in commercial activity. Back-to-School season is a perfect way for us to demonstrate a brand new feature of our audience reports — specifically YouTube channel insights. For this analysis, we identify which YouTube channels are most relevant to Back-to-School shopping enthusiasts.
While advertising optimization has been traditionally focused on reach, forward-thinking brands are optimizing for ROI. Understanding the niche audiences that are best aligned is the first step in that process.
These insight can inform media buyers, very quickly increasing efficiency in targeting their most relevant audience while leveraging YouTube’s incredible reach. Media sellers on YouTube can also leverage this data to optimize their pitches and campaigns, ensuring they work with the best possible advertisers most aligned with their audience.
Methodology
We looked back over the past 30 days to identify a sample of approximately 25,000 consumers engaging with popular back-to-school (B2S) hashtags, including #back2school, #backtoschool, and #”backtoschool.” We then overlaid that audience against the 10,000+ media properties in our taxonomy, which now includes nearly 1,500 YouTube channels.
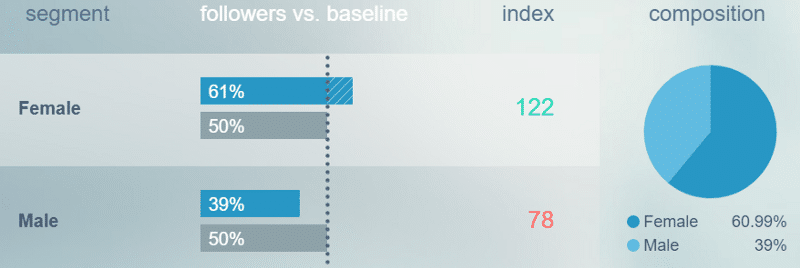
Back-to-School Audience Demographics
The B2S enthusiasts are then compared to the average American on social media, built off a baseline of more than 100 million people. We then can pinpoint what makes the back-to-school enthusiasts unique across a variety of demographic, psychographic, and affinity data points. Right off the bat, and perhaps not surprisingly, this is a majority female crowd.
StatSocial’s Media Taxonomy
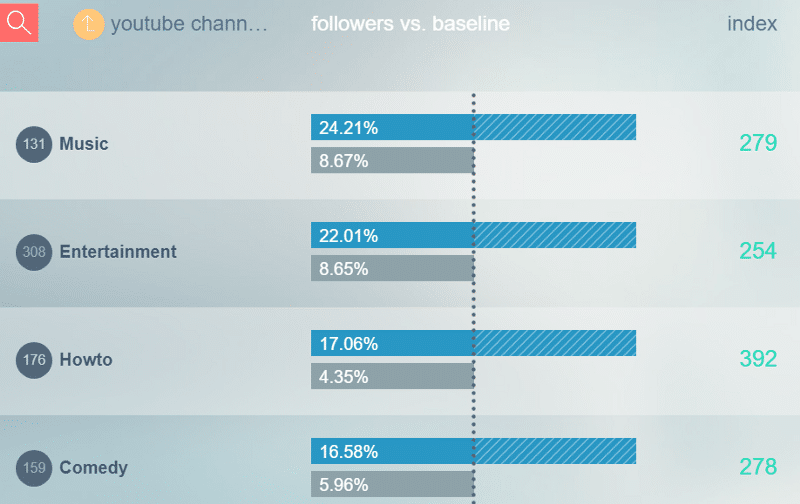
Every StatSocial audience report includes over 10,000 media properties, encompassing movies, TV shows, YouTube channels, podcasts, websites, and more. Let’s zoom in on the YouTube channel affinities.
The leading YouTube categories for the pre-dominantly female B2S crowd are Music, Entertainment, HowTo, and Comedy. Interestingly, all of these top categories have a significant over-index which demonstrates that B2S audience is 3–4 times more into Music, Entertainment, Comedy and HowTo content on YouTube than an average social media user.
Back-to-School enthusiasts love YouTube
If we look at YouTube’s share within the entire media world, YouTube channels have the highest over-index compared to the other types of media.
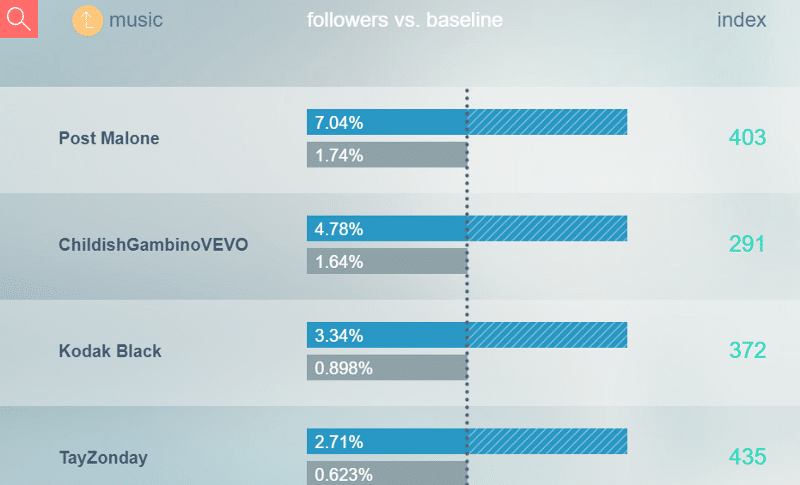
Back-to-School Shoppers Favorite YouTube Music Channels
Now, let`s drill down the YouTube taxonomy and identify which channels are most loved by the B2S enthusiasts. Starting with Music, we see that our audience enjoys watching videos of Post Malone, Childish Gambino, Kodak Black and TayZonday. All of these artists are significantly over-indexed against the average American, validating the fact that B2S enthusiasts strongly prefer these musicians on YouTube.
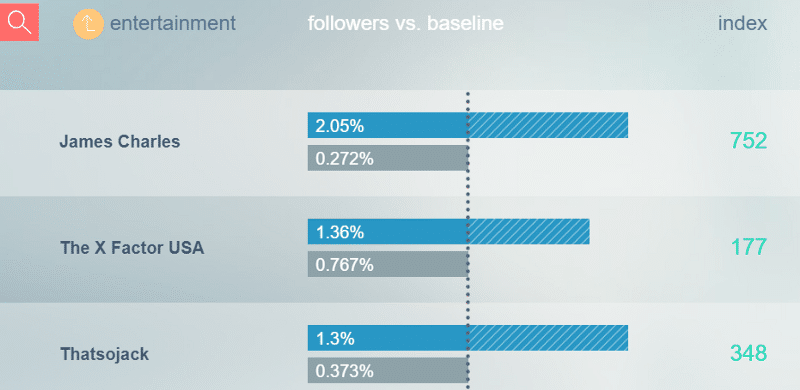
Back-to-School Shoppers Favorite YouTube Entertainment Channels
Next up are Entertainment channels on YouTube. James Charles is leading in this category with a whopping 752 index score! It means that B2S audience likes/shares/tags James Charles 7 times more than an average social media user. James Charles is an American internet personality, makeup artist, and model known for being the first male CoverGirl spokesperson. It is predictable that the women in this audience are interested in makeup, yet… out of a myriad of Internet personalities, celebrities and performers, James Charles gathers the most over-indexed fandom.
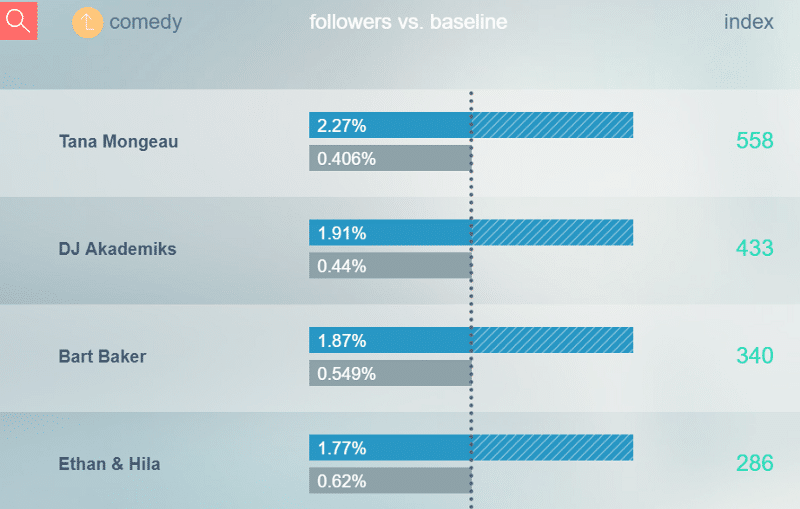
Moving on to Comedy-focused YouTube channels. We can see that our target audience is watching MANY comedians. There is no single comedy channel on YouTube that takes up a lion`s share of the B2S group. On the opposite, our audience likes a very wide range of channels that produce comedy content. Nonetheless, we can still see that Tana Mongeau and DJ Akademics have a significantly higher interest from the B2S than from average social media users in the US.
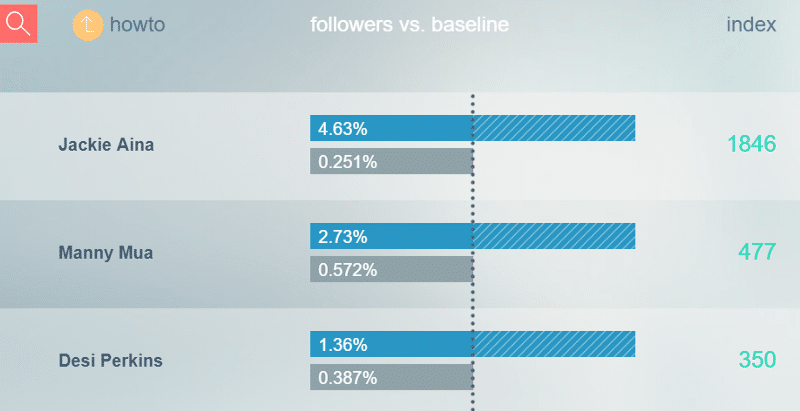
In the HowTo segment, Jackie Aina is leading the chart of the top HowTo vloggers for our group of interest. Her channel has a huge overindex of 1,846. None of the other channels from Music, Entertainment or Comedy segments have such a strong affinity to a seemingly niche beauty influencer: only 0.25% of social media users follow Jackie Aina online. It is very interesting that our B2S share so much affinity for this specific HowTo YouTuber.
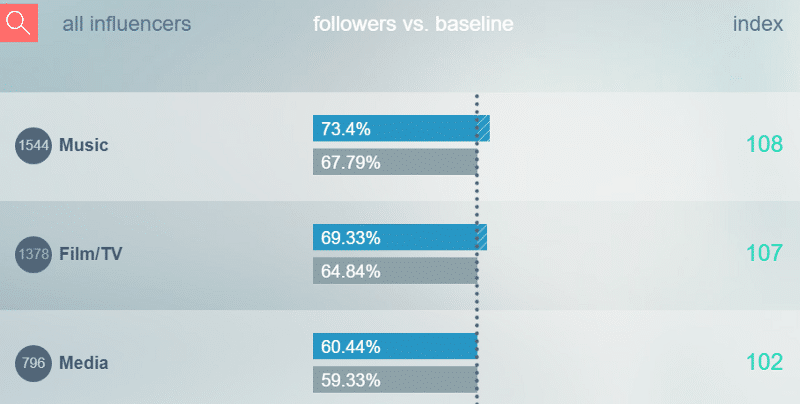
Back-to-School Shoppers Top Influencer Categories
Across Back-to-School audience’s top YouTube categories, Music has the most concentrated interest around the top channels whereas Entertainment, Comedy, and HowTo interest is much more dispersed among dozens of channels. We cross-checked this fact by researching Statsocial’s influencer taxonomy in the B2S report. Music was the leading influencer category, which shows that Music content is important to the B2S crowd within YouTube as well as outside of it.
If you are new to us, we are StatSocial, the leading social audience insight platform on the market today. We help brands, publishers, and agencies understand and target their audiences. We invite you to click HERE to check out our website. Please click around and explore some of our sample reports to get a sense of everything we can uncover.
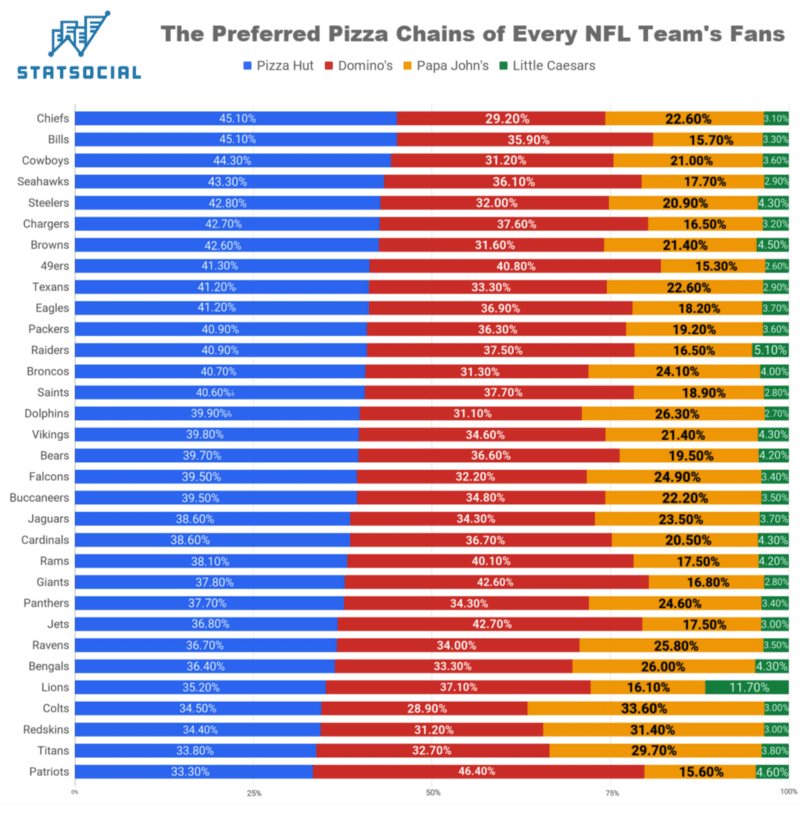
Kansas City is Pizza Hut Country, and the Chiefs’ fans know it. Patriots fans and Rams fans alike love Domino’s. Little Caesars performs best in Detroit while Papa John’s has a lot of fans in Indy and DC.
Super Bowl LIII, featuring the (so-frequently featured in the postseason) New England Patriots and the Los Angeles Rams, is happening so soon we can taste it. As occurs in mouths from Dorchester to Santa Monica on a daily basis, but will be taking place to an inordinate degree on Super Sunday 2019, is the tasting of pizza. We can all taste that, no matter the time of year. Are we right, or are we right?
For the past couple of weeks we’ve been applying the sharp and powerful StatSocial audience analysis tool to the important work of learning all sorts of things about every NFL team’s fans. We’ve uncovered which team’s fans are most emotional, most (or least) Millennial, and we dug into their preferences when it comes to pizza’s most perfect pairing — provided you’re over 21-years of age — good ol’ brewskis. You can check out all the entries we’ve done, and will do, in this series at the StatSocial blog here.
“Hey pizza! It’s great! Let’s dig in!”
-Dee Dee Ramone, ‘Rock and Roll High School’
You scream, I scream, we all scream for pizza. The lack of a rhyme doesn’t make this fact any less true.
Setting aside our New York elitism, and loyalty to the literal hundreds upon hundreds of genuinely mind-blowing mom ’n’ pop pizza joints that can be found virtually every few blocks within our city (and many others, we know that other cities have great pizza too… or at least we’ve been told as much), today we focus on our great nation’s major pizza chains: Domino’s, Pizza Hut, Papa John’s, and Little Caesars.
The below graphic reflects our calculations after looking at hundreds of thousands of each NFL team’s fans who are also fans of one of the four pizza chains in question. With those fans identified, we were able to determine the proportions of each chain’s admirers dwelling within each team’s fan base.
Observe….
Click to Enlarge. 45.10% of the Kansas City Chiefs’ fans who are fans of one of the four chains in this study prefer Pizza Hut. 3.10% of those same Chiefs fans dine on Little Caesars. 46.40% of the Patriots fans analyzed in this study prefer Domino’s. 4.60% favor Little Caesars.
It’s close, but Pizza Hut is the victor here. Domino’s is not at all far behind, though. Papa John’s is in the game, but is still comfortably our bronze medalist.
Little Caesars is coming up the rear. The chain does, however, get a pronounced regional boost. Founded in the Detroit metropolitan area’s Garden City, Michigan, the Lions find the largest proportion of Little Caesars admirers among their fans.
Of course, Domino’s pizza was founded in the Detroit suburb of Ypsilanti, Michigan, and it finds an even larger proportion of diners among the Lions fans. A proportion, however, only a smidge larger than that which grooves on Wichita, Kansas’ Pizza Hut. Home team pride is real, but at the end of the day, the heart (and the stomach) wants what it wants.
While speaking of Kansas and the international pizza chain to which it did give birth, we find the team with the largest proportion of Hut-worshipers located right over the border from the Jayhawk State, in the Show Me State. Fans of the Chiefs reside in both states, of course, and it would seem a heck of a coincidence if the Pizza Hut chain’s geographic origins weren’t something of a factor here.
Where Domino’s is kicking the most butt — if you’ll pardon our French — is within the region of our beautiful country called New England. Fans of the Patriots love Domino’s while admiring their local foliage, and they adore it while digging their cars out from under three feet of snow for the 20th time that year. Oh, and also while celebrating their team’s frequent divisional, conference, and yes even league championship victories.
If you want to unnerve your Super Bowl pizza party, find a creepy toy like this, and plop it right in the middle of one of the pies you’re serving. Things will have to be a couple of hours, and a few rounds of beer, in before that pizza is getting touched.
Bookmark This Page
We’re not through here yet.
We’ll be visiting even more subjects of this general nature — all highlighting the rich and varied affinities of each NFL team’s fans — in these last few days in the run up to Super Bowl LIII.
And check out the written matter in the footer, and reach out to us if you have any questions or would like to see much, much more.
Hometown pride, perhaps, finds the Falcons’ fans most partial to Coke. Buffalo Bills’ enthusiasts, on the other hand, exhibit the strongest fondness for Pepsi.
Super Bowl LIII is coming down fast. The New England Patriots and Los Angeles Rams will be descending upon Atlanta’s Mercedes-Benz Stadium with an eye on hoisting the Vince Lombardi Trophy upon their burly shoulders, and announcing to the world their plans to go to Disney World.
In the ever ramping up anticipation, we are continuing with our series of blog entries applying the might and diversity of the StatSocial audience analysis tool to the fan bases of every NFL team. While demonstrating only a peek into StatSocial’scapabilities, it has enabled us to consider the nation’s most dedicated football fans from a number of different perspectives. After reading this entry, head on over to the greater StatSocialblog for more.
This One Here Is a Biggie
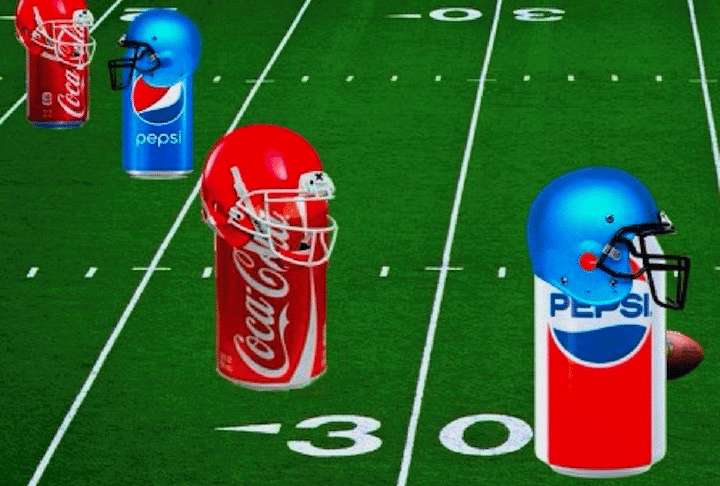
The Hatfields and the McCoys, Ali and Frazier, the Yankees and the Red Sox, ‘The Munsters’ and the ‘Addams Family.’ In our world, there have been precious few rivalries that have even begun to approach that which has raged for æons between Coke and Pepsi.
If cola weren’t so awesome, it would almost seem frivolous. Cola, alas, is that awesome, and so this is some quite serious business.
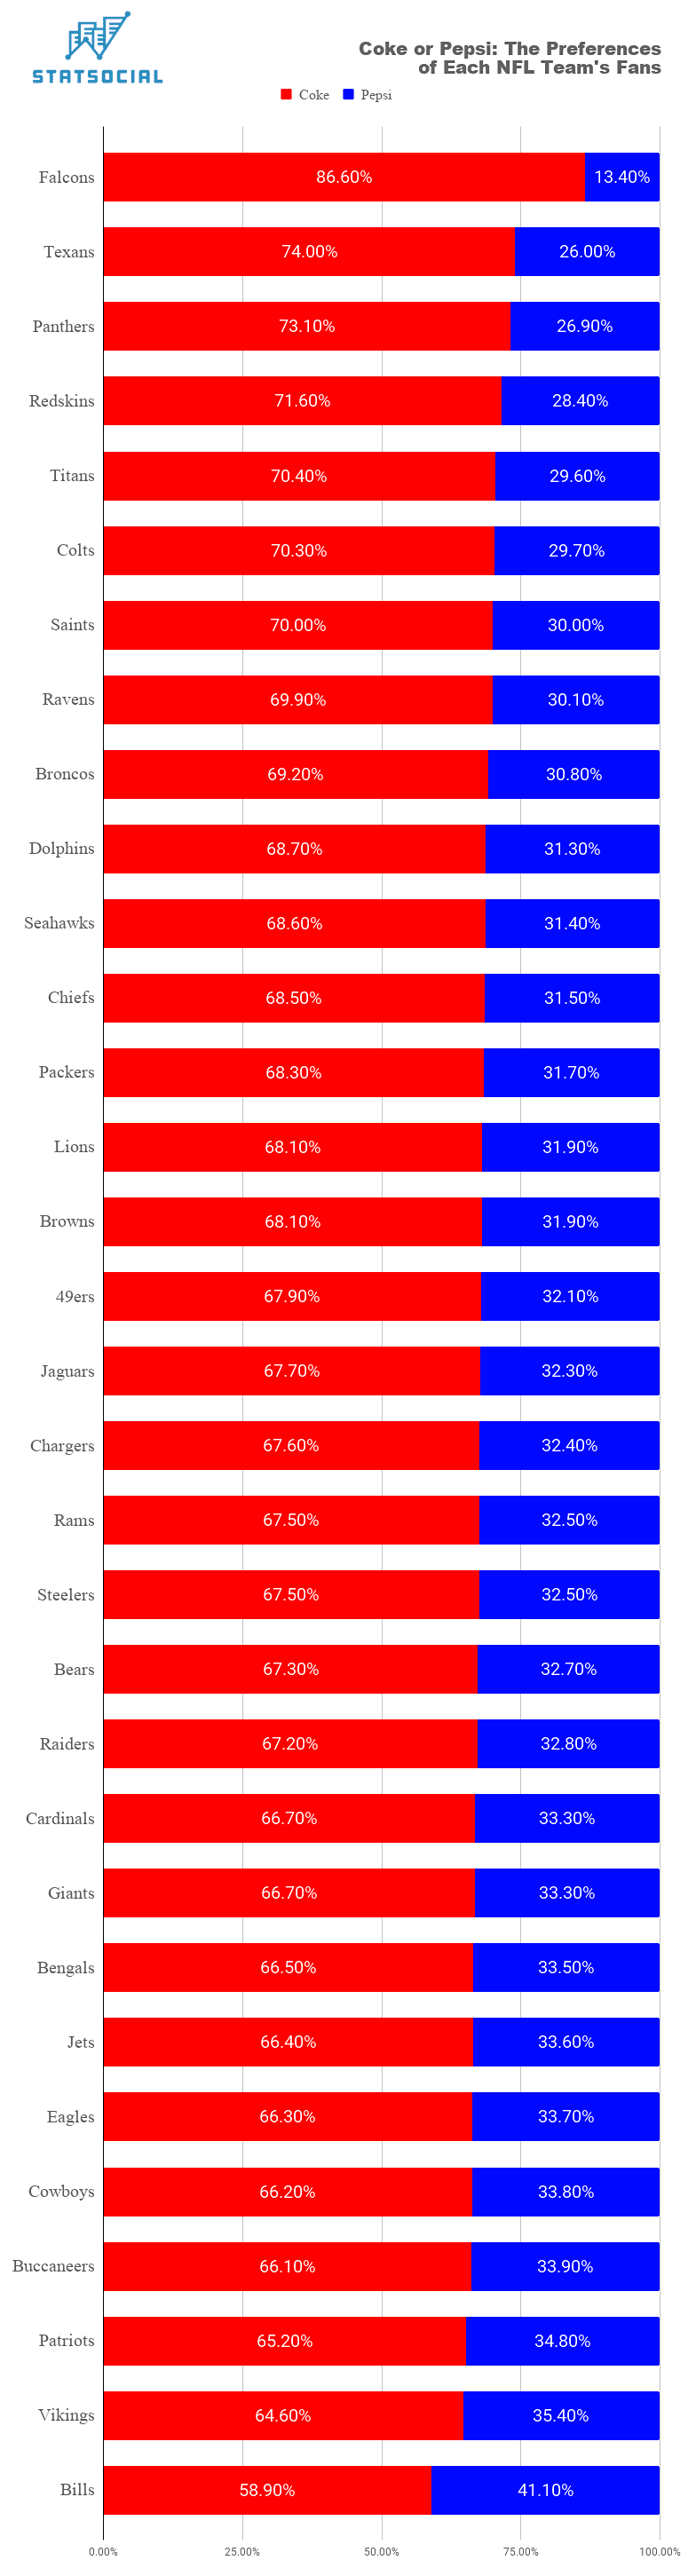
Proportion of Coke vs. Pepsi Drinkers Among Each NFL Team’s Fans
With the below graphic, we show the results of our analysis. We’ve looked at hundreds of thousands of NFL fans, identifying all of those who drink Coke or Pepsi. From there, we’ve calculated preferences on a team-by-team basis. With this, we can see which cola is preferred — with those who drink cola — among each team’s fans.
Atlanta, Atlanta, That Toddlin’ Town
A rendering of what was The Coca-Cola building in Atlanta. The soft drink manufacturer’s home from 1909 to 1920.
By a rather sizable margin, the Falcons find themselves with the largest percentage of Coke drinkers in their midst. Atlanta is known for a lot of things, and has been home to its fair share of industry and successful businesses. Nothing to originate from Atlanta, however, has proved more enduring and iconic than their delicious, carbonated soft drink (sorry Ted Turner). Arguably, it’s the most famous American brand in the world. Top five, surely.
In a move roughly akin to Godzilla, Rodan, and Mothra bringing their beef with King Ghidorah to the streets of Manhattan, Coke and Pepsi have duked it out globally, trying to win over the tastebuds of all the planet’s inhabitants.
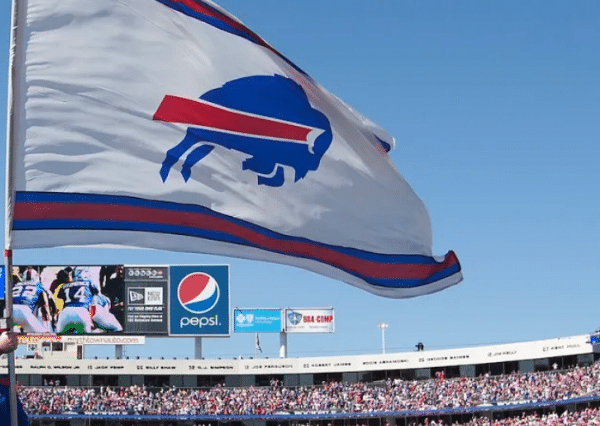
Shuffle Off to Buffalo, For Some Pepsi and Wings
While this sweet and immensely popular drink was initially developed in North Carolina, the Panthers’ audience seems to reside cozily in Coca-Cola country.
Pepsi is now headquartered in Westchester County, New York. While in the same state, it is highly unlikely that geography is any sort of a factor in the popular soft drink finding the largest proportion of admirers among the fans of the Buffalo Bills. Buffalo, you see, is a good 400 miles from Pepsi HQ.
Pepsi shares a logo color-scheme with the Bills, which is coincidental, but does make for Pepsi’s branding integrating niftily into Bills related ephemera. Pepsi is also, not for nothing, the official soft drink of the Buffalo Bills.
I’d Like to Teach the World to Sing
Perhaps now would not be the greatest time to point out that — while they do so to the smallest degree of all the team’s fan bases — Bills fans on the whole do prefer Coca-Cola as well.
The parent corporations of each American soft drink perennial manages a rich and diverse portfolio of food and beverage brands. The profitability of each company, on the whole, is not quite so easily summed up, and will vary from year to year. When it comes to the delicious, brown and bubbly drinks upon which these companies have built their empires, though, the NFL’s fans rather decidedly prefer Coca-Cola.
We’ll be visiting numerous subjects of this general nature — all highlighting the rich and varied affinities of each NFL team’s fans — in the days running up to Super Bowl LIII.
And check out the written matter in the footer, and reach out to us if you have any questions or would like to see much, much more.
In this series we’re puttingStatSocial, our social media audience insights engine, to work.
We’re checking in on the audiences of some of those companies whose names will be familiar to any regular podcast listener, as they are among the most prominent sponsors of many of the most popular podcasts.
What are we trying to determine? Above all else, for which brands do the most passionate members of these podcasts’ audiences show the strongest affinities? StatSocial scores audience affinities for 1,000 top podcasts in every audience report. In this series, we’ll show you the top-five podcasts audiences that are best aligned to the brand in question.
For marketers and agencies looking to optimize podcast ad spend, StatSocial is an indispensable tool. StatSocial also works for podcast ad sellers and networks looking to best position their podcast properties to the right advertisers. This article is a window into what StatSocial can uncover for ad buyers and sellers of all sorts.
Head to the greater StatSocial Insights blog by clicking here, and check out our exploration of more podcast sponsors, as well as a number of other topics into which we’re the best qualified to take the deep dive.
The ZipRecruiter platform is designed to aid both talent and employers in finding one another in a more efficient, and less time-consuming way than many other platforms for those seeking employment and/or staff.
They are the number one rated job search app on Android and iOS, and boast over seven million active users month in and month out.
Over 77% of their social media audience — who, of course, we must remember includes employers and recruiters as well as job-seekers — are ages 35 and up. 43% are over 45-years of age.
1) Entrepreneurs On Fire
John Lee Dumas — an Iraq vet, having served in the Army as an Armor Platoon Leader, before being honorably discharged in 2010 — produces the EOFire podcast seven days a week. His daily interviews — conducted, on his part at least, from Puerto Rico where he currently resides — have included such entrepreneurs as Seth Godin, Barbara Corcoran, and those mentioned in previous entries from this series, such as Tim Ferriss and Gary Vaynerchuk.
While seeking to work for someone else in the moment, or find someone to work for them, it seems the ZipRecruiter crowd is motivated to learn more about those who have made things happen for themselves. They are 42 times more likely to be members of the EOFire audience than those you’d normally find lurking around cyberspace.
In the interest of full disclosure we must mention that John and StatSocial’s CEO Michael Hussey grew up together in Maine, and are close friends to this day. That being said, we stress that the StatSocial platform is, as the name suggests, solely statistically based and this list is 100% impartial.
2.18% of ZipRecruiter’s audience have recently discussed or shared content related to Entrepreneurs On Fire podcast compared to .052% of Americans.
2) The Investors Podcast — We Study Billionaires
It’s an ambitious lot ZipRecruiter finds in their social media sphere.
Preston Pysh and Stig Brodersen, the fellows studying the billionaires so we don’t have to, describe their podcast thusly, “First, we like to have fun. Second, we read and talk about the books that have influenced billionaires the most. We typically talk about Warren Buffett, Charlie Munger, Ray Dalio, Stanley Druckenmiller, George Soros, and other financial billionaires.”
The likelihood of finding one of their listeners among ZipRecruiter’s employers/hopeful-employees is over 30 ½ times greater than finding them just wandering among the general social media throngs.
2.38% of ZipRecruiter’s audience have recently discussed or shared content related to the We Study Billionaires podcast compared to .078% of Americans.
Those in search of meaningful employment while expending minimal fuss find among their fellowship those who also seek to study at the feet of greatness. Those fitting the latter description occur within this audience nearly 29 times more frequently than you’d find their ilk among the general social media crowd.
2.61% of ZipRecruiter’s audience have recently discussed or shared content related to The School of Greatness podcast compared to .09% of Americans.
4) APM: Marketplace
After NPR, the second biggest producer and syndicator of public radio in America is American Public Media. Their Kai Ryssdal hosted Marketplace “focuses on business, the economy, and events that influence them.”
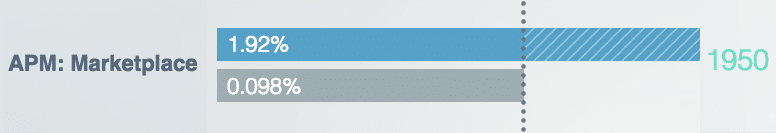
The ZipRecruiter bunch are 19 ½ times more likely to be among the Marketplace audience than the average.
1.92% of ZipRecruiter’s audience have recently discussed or shared content related to the Marketplace podcast compared to .098% of Americans.
This audience is 18 times more likely to seek Chris’ counsel for picking up a bit of, you know, “walking around money” than those you’d find mingling among the general social media folks.
1.79% of ZipRecruiter’s audience have recently discussed or shared content related to the Side Hustle School podcast compared to .099% of Americans.
We use cookies on our website to give you the most relevant experience by remembering your preferences and repeat visits. By clicking “Accept All”, you consent to the use of ALL the cookies. However, you may visit "Cookie Settings" to provide a controlled consent.
This website uses cookies to improve your experience while you navigate through the website. Out of these, the cookies that are categorized as necessary are stored on your browser as they are essential for the working of basic functionalities of the website. We also use third-party cookies that help us analyze and understand how you use this website. These cookies will be stored in your browser only with your consent. You also have the option to opt-out of these cookies. But opting out of some of these cookies may affect your browsing experience.
Necessary cookies are absolutely essential for the website to function properly. These cookies ensure basic functionalities and security features of the website, anonymously.
Cookie
Duration
Description
cookielawinfo-checkbox-analytics
11 months
This cookie is set by GDPR Cookie Consent plugin. The cookie is used to store the user consent for the cookies in the category "Analytics".
cookielawinfo-checkbox-functional
11 months
The cookie is set by GDPR cookie consent to record the user consent for the cookies in the category "Functional".
cookielawinfo-checkbox-necessary
11 months
This cookie is set by GDPR Cookie Consent plugin. The cookies is used to store the user consent for the cookies in the category "Necessary".
cookielawinfo-checkbox-others
11 months
This cookie is set by GDPR Cookie Consent plugin. The cookie is used to store the user consent for the cookies in the category "Other.
cookielawinfo-checkbox-performance
11 months
This cookie is set by GDPR Cookie Consent plugin. The cookie is used to store the user consent for the cookies in the category "Performance".
viewed_cookie_policy
11 months
The cookie is set by the GDPR Cookie Consent plugin and is used to store whether or not user has consented to the use of cookies. It does not store any personal data.
Functional cookies help to perform certain functionalities like sharing the content of the website on social media platforms, collect feedbacks, and other third-party features.
Performance cookies are used to understand and analyze the key performance indexes of the website which helps in delivering a better user experience for the visitors.
Analytical cookies are used to understand how visitors interact with the website. These cookies help provide information on metrics the number of visitors, bounce rate, traffic source, etc.
Advertisement cookies are used to provide visitors with relevant ads and marketing campaigns. These cookies track visitors across websites and collect information to provide customized ads.