by Emma Marsh | Jul 7, 2021
If you ask a group of marketers how they go about developing audience personas, odds are that they’ll all have varied approaches—usually a combination of consumer research, analysis, and perhaps even a bit of trial and error.
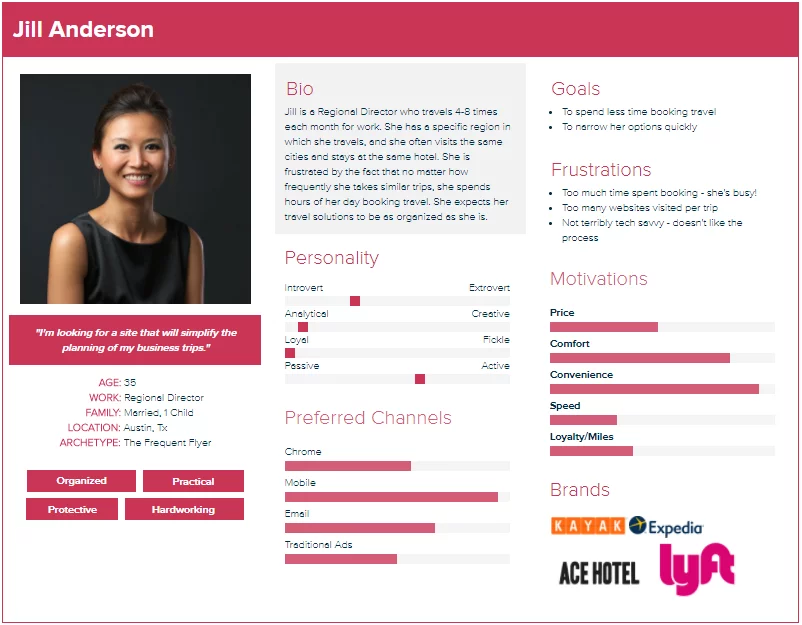
Ask that same group of marketers if they’re 100% confident that their audience personas are an accurate representation of their buyers and you’re more likely to get a unified response of uncertainty. That’s because nailing down personas is as difficult as it is important. Let’s take a look at a typical audience (or buyer) persona:
While the above is a great starting point, it’s lacking. And that’s because it—like most customer profiles—relies on superficial information about the consumer that when boiled down, doesn’t reveal much about them.
A big reason why is that marketers rely heavily on first party data (a company’s own data) to create personas. If you were to put each persona they developed side-by-side, we’d be willing to wager they don’t look too different from each other. After all, most consumers are motivated by some combination of price, comfort, and frictionless customer experience.
Despite the above, we know personas are important. 93% of companies who exceed their lead and revenue goals segment their database by buyer persona. Imagine just how effective your marketing campaigns could be if you had buyer personas that moved beyond first-party data to understanding their affinities, interests, and what motivates them to purchase.
How do you accomplish this? Cue social audience insights.
The importance of social insights to buyer personas
Knowing if your audience prefers Chrome to Safari or is more analytical vs. creative isn’t particularly useful (unless your product has a Chrome plug-in). What is useful is understanding your audience’s interests, affinities, and motivations on a deeper level—which will reveal far more actionable insights relevant to your brand’s goals. To gain access to these insights, you need to go to where people spend an overwhelming amount of their time and share the most meaningful details—social media.
A solid social audience insights platform allows you to pick your target audience criteria and track key insights about their behavior across various social channels from who they follow to the type of content they share and engage with. Basically, you can connect the dots between social channels to gain a deeper understanding of your audience.
And that’s just the beginning of what you can do with these rich audience insights. Let’s take a look at four ways social audience data can enhance your marketing strategy.
1.) Gain a holistic view of audience
Every marketer wants to understand what influences their customers’ decision-making and as we discussed above, social insights offer a direct view into this line of thought by filling in the gaps. First-party data primarily focuses on demographics (e.g. age, location, etc.) and purchase history whereas the right social data reveals behavioral insights like their self-declared interests and affinities. Only when you put the two together can you truly understand a customer’s interactions with your own brand and finally have the holistic view necessary to effectively develop and inform your personas.
2.) Target audiences based on unique persona attributes
Once you understand who your customer-base is, creating marketing campaigns to target more people just like them is easy. The right platform will allow you to model social audiences after unique persona attributes like interests, hobbies, and affinities that your customer base shares so that you can tailor your messaging to reach them.
3.) Enhance outreach on paid or other channels
Another benefit to a solid social audience insights platform is the ability to determine how different audiences engage with social channels or other earned media outlets. Understanding this will help you to create a far more superior outreach strategy by honing in on the right distribution channels—from influencer partnerships to leveraging specific content—to engage with your ideal audience.
4.) Enrich your CRM Data
We all know that there’s a continuous disconnect between insights gained on marketing platforms and a marketer’s own first-party data. Integrate social audience insights with your CRM dataset to reveal your customer’s identity and their interaction with your brand across any platform. This will provide you with a comprehensive and accurate representation of your customers to inform your future marketing strategy.
Final thoughts
As marketers, our goal is to not only discover who our target audience is, but how to reach as many of them as possible. If you’re ready to have a holistic view of your audience so that you can start building highly effective campaigns today, check out StatSocial’s Silhouette Platform.

by Andrea Rosi | Jun 30, 2021

How often do you use social media? For most of us, more than we’d like to admit. On average, people spend
over 2 hours a day on various social platforms. It’s a fixture in our everyday life—making it a goldmine for consumer insights.
Despite all of this, it wasn’t until recently that gathering social insights for audience analysis really took off. This is largely because popular social listening platforms focus on content trends rather than audience insights. Even those few tools that do claim to capture audience data can often only do so for one social channel (e.g. Twitter).
Without a holistic understanding of buyer behavior across social and community forums, the largest (and arguably most important) piece of the puzzle is missing.
So what insights do you stand to gain about your audience from the right platform? Here are just a few:
-
- Influencers & thought leaders they engage with
- Preferred media channels (e.g. YouTube, LinkedIn, Pinterest etc.)
- Competitive & industry trends
- Brand affinities
- Interests, hobbies, and passions
How Social Insights Help You to Better Target Your Audience
Let’s take a look at three things a social audience insights platform can do for you:
1. Get to know your audience.
Marketers like to think they know their target audience, but surveys and market research only scratch the surface of what social insights will glean.
A powerful social audience insights platform gathers data on user interactions across various social and community platforms and presents it in a single view. By tapping into your audience’s interests, personality traits, and other key attributes, you can finally understand not only who they are, but how and where to best engage them.
2. Enrich your first-party data.
The data your company collects about their customers is called first-party data. Overlay social audience insights on top of your CRM or other first-party datasets to help you:
-
-
-
- fully understand what drives your audience’s decision-making
- build more accurate and comprehensive personas
- take a more targeted approach to your marketing outreach
3. Inform your influencer marketing.
A recent survey showed that just under 90% of marketers agreed that influencer marketing is just as effective—if not more so—than any other marketing channel they use. But this is contingent upon whether you use the most effective influencer for your audience.
Most social platforms identify influencers based on their posting topics (e.g. moms, fitness, fashion). But a much better approach is to see what influencer content your audience actually engages with.
Consider the following example: you’re targeting runners for a sneaker campaign. Of course you can hire the big-name sneaker influencers but imagine if you were able to discover other micro and macro influencers that are far more influential to your target audience based on their engagement history. The end result is a far more powerful campaign.
Imagine if you’re finally able to know—not guess— who your buyer is and what that would mean for your marketing campaigns. If you move beyond the standard social listening tools to one that gathers audience insights, you can achieve this.
Navigating Social Audience Data in a Cookie-less World
Social media gives you invaluable and (seemingly) endless data about your audience in real time. But what happens when cookies go away? StatSocial’s founder Michael Hussey recently discussed the topic with Search Engine Watch. Soon marketers (and everyone else, for that matter) will need to rely on identity solutions to provide their services and perform accurate audience analysis.
While change is always a bit scary, this cookie-less future is a good thing. Consumer information is rightfully protected and companies will gain more accurate insights and data about their consumers leading to higher-quality target audiences.
The Future Is Social
As we usher in a new era of audience analysis, one of the most important investments you can make is in a social audience insights platform. Social media continues to be a major source of where consumers spend their time.
There’s no question that the best insights you can glean about your audience will derive from the sources they spend the majority of their time on—social media.
Ready to know exactly who your customer is? Request a demo today.
by StatSocial | Jan 25, 2021
Recently we unveiled something brand new for StatSocial — B2B data married to our patented identity graph, made available through our audience intelligence platform Silhouette.
The resulting insights are ready to be leveraged across our key use cases (insights, attribution, and activation). This is an unprecedented opportunity for B2B marketers to analyze more than 40 million business people, including the companies they work for, industries they work in, and job titles, all cross-referenced against Silhouette’s industry-leading insights.
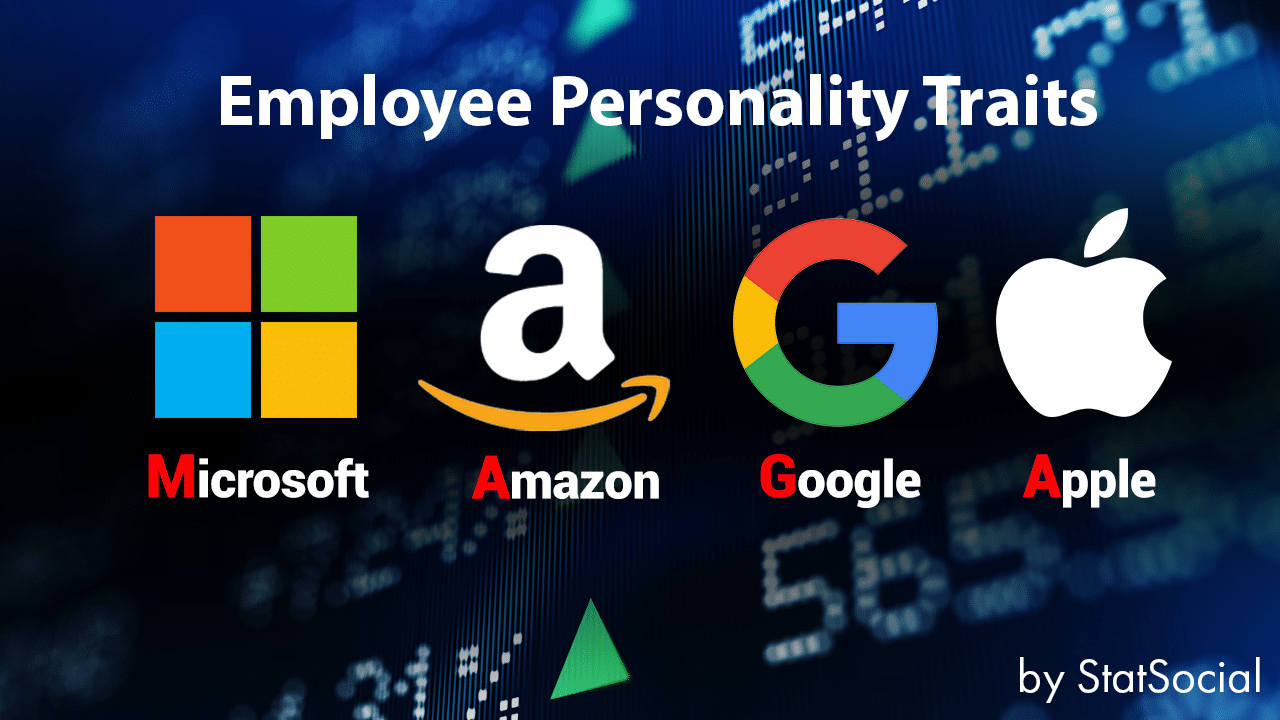
To demonstrate the power of B2B audience data inside of Silhouette, we’ll be sharing a series of entries comparing the employees of tech giants Amazon, Apple, Google, and Microsoft. If you’d like to see similar insights on other B2B data-sets, please contact us.
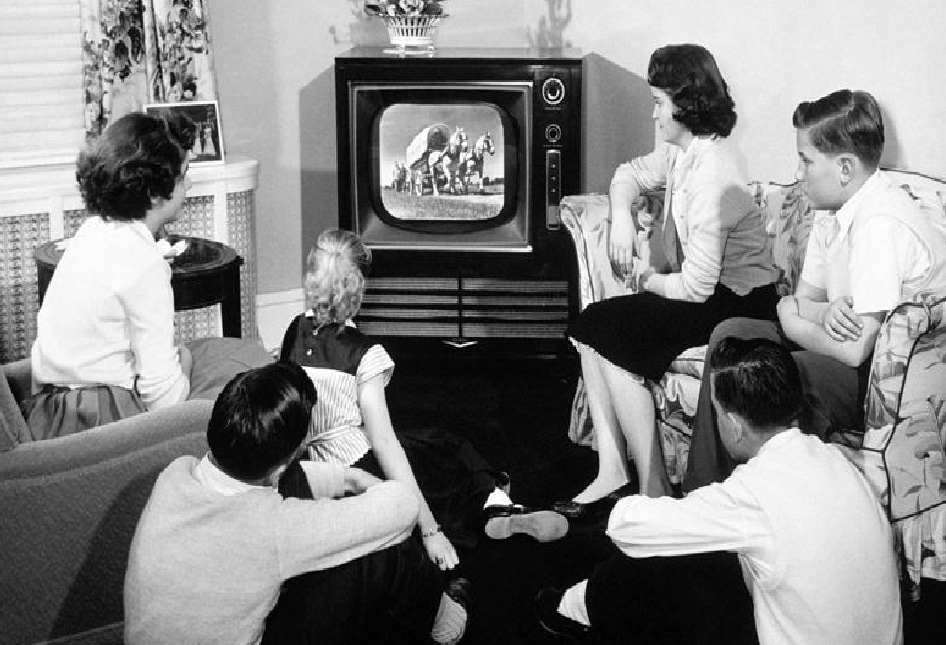
Using Silhouette, we are able to analyze an audience through the lens of nearly 85K insights, many unique to StatSocial. Here, we are focused on preferred television shows.
We’ve learned which five TV programs rate most prominently among the employees of each company, by contrasting their TV viewing preferences with those of the average American consumer. The below infographic reports the results.
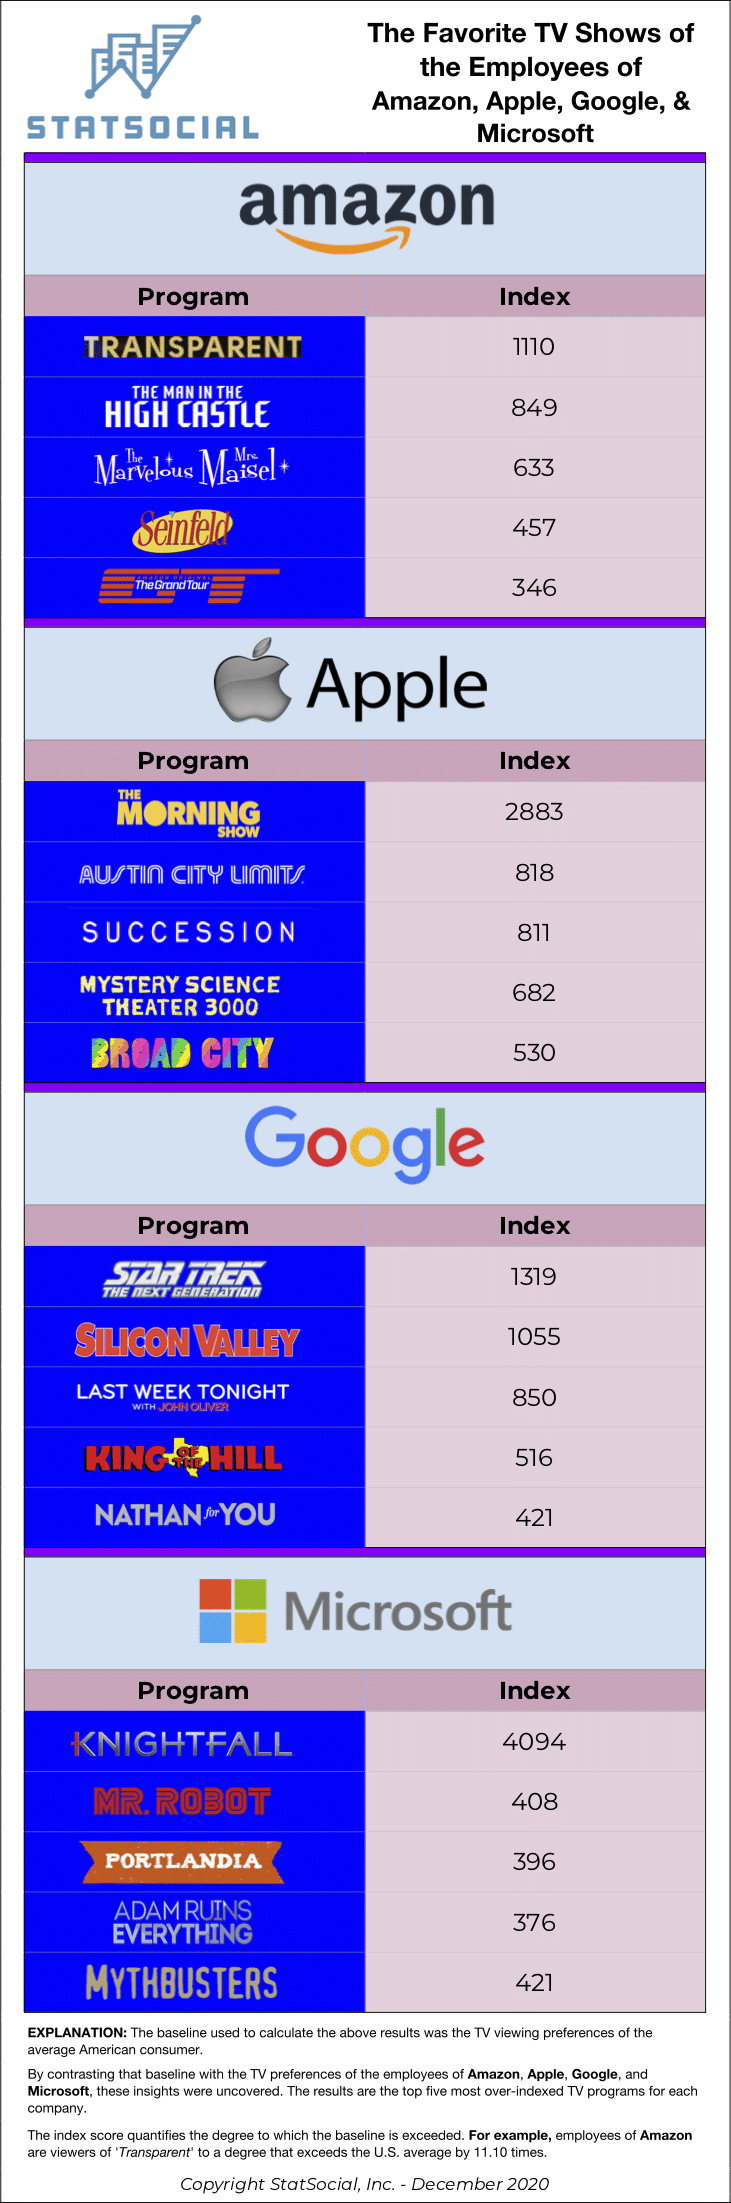
Four Amazon Prime streaming series — Emmy winners, ‘Transparent,’ ‘The Marvelous Miss Maisel,’ and ‘The Man in the High Castle,’ as well as ‘The Grand Tour‘ — rate highly among those who work for the service’s parent company. Viewers of ‘Transparent‘ are 11.10 times more likely to be found among this group than among the average American consumer audience.
Apple‘s employees also show preference for their own. Apple TV+‘s Jenifer Aniston and Reese Witherspoon starring, ‘The Morning Show,’ finds favor among the company’s employees to a degree that exceeds the baseline by 28.83 times.
The Google bunch are, in part, Trekkies/Trekkers, with ‘Star Trek: The Next Generation‘ rating as a favorite among their employees to a degree exceeding the U.S. average by 13.19 times.
Finally, the employees of Microsoft are viewers of the History network’s drama, ‘Knightfall’ (a fictionalized telling of the tale of 12th-to-14th century Catholic military order, Knights Templar), to a degree surpassing the baseline by 40.94 times.
——————————————————————————————
How It Works
INSIGHTS
When trying to convey the depth, breadth, and scale of StatSocial‘s Social Affinity and Earned Media data, we sum it up like this: Imagine an 85,000 question survey given out to 300 million consumers. Now, imagine this already incredible thing as a living, dynamic data set. This survey is being administered in real time, constantly, being continually refreshed to include all of the most up-to-date opinions, choices, affinities, and actions. Learn more here.
ATTRIBUTION
Marketers and media-sellers know that Earned Media and Influencer Marketing are valuable components of their campaigns. Attributing a definitive worth to either, however, has traditionally been elusive. As StatSocial’s analyses report of with what topics and influencers an audience’s members have been engaging, a marketer can now directly attribute website and offline conversions. The same metrics that marketers have long relied upon to quantify the value of a campaign’s Paid and Owned Media components, are now just as readily available for Earned Media. Learn more here.
ACTIVATION
StatSocial‘s vast and comprehensive taxonomy is accessible across every programmatic platform. Our partnership with Liveramp, and direct integrations with such leading platforms as Viant, Oracle Data Cloud, Eyeota, and Lotame, finds StatSocial‘s insights available everywhere you access audience data. We are also available, via our 24/7 online to get you the insights and audiences you need, when you need them. Learn more here.
by StatSocial | Dec 14, 2020
 This is another entry in our series unveiling something brand new for StatSocial .
Our clients now have, at the ready, a mountain of B2B data married to our patented identity graph and audience intelligence platform Silhouette. All of this is ready to be leveraged across our key use cases (insights, attribution, and activation). This is an unprecedented opportunity for B2B marketers to analyze more than 40 million business people, including the companies they work for, industries they work in, and job titles, all cross-referenced against Silhouette’s industry-leading insights.
To demonstrate the power of B2B audience data inside of Silhouette, we’ve been posting these entries comparing the employees of tech giants Amazon, Apple, Google, and Microsoft. If you’d like to see similar insights on other B2B data-sets, please contact us.
The analysis below was completed by analyzing over 30K employees from each company. For this entry, we’re highlighting one of our most unique sets of insights, here considered through the B2B perspective — provided with a little help from IBM Watson™.
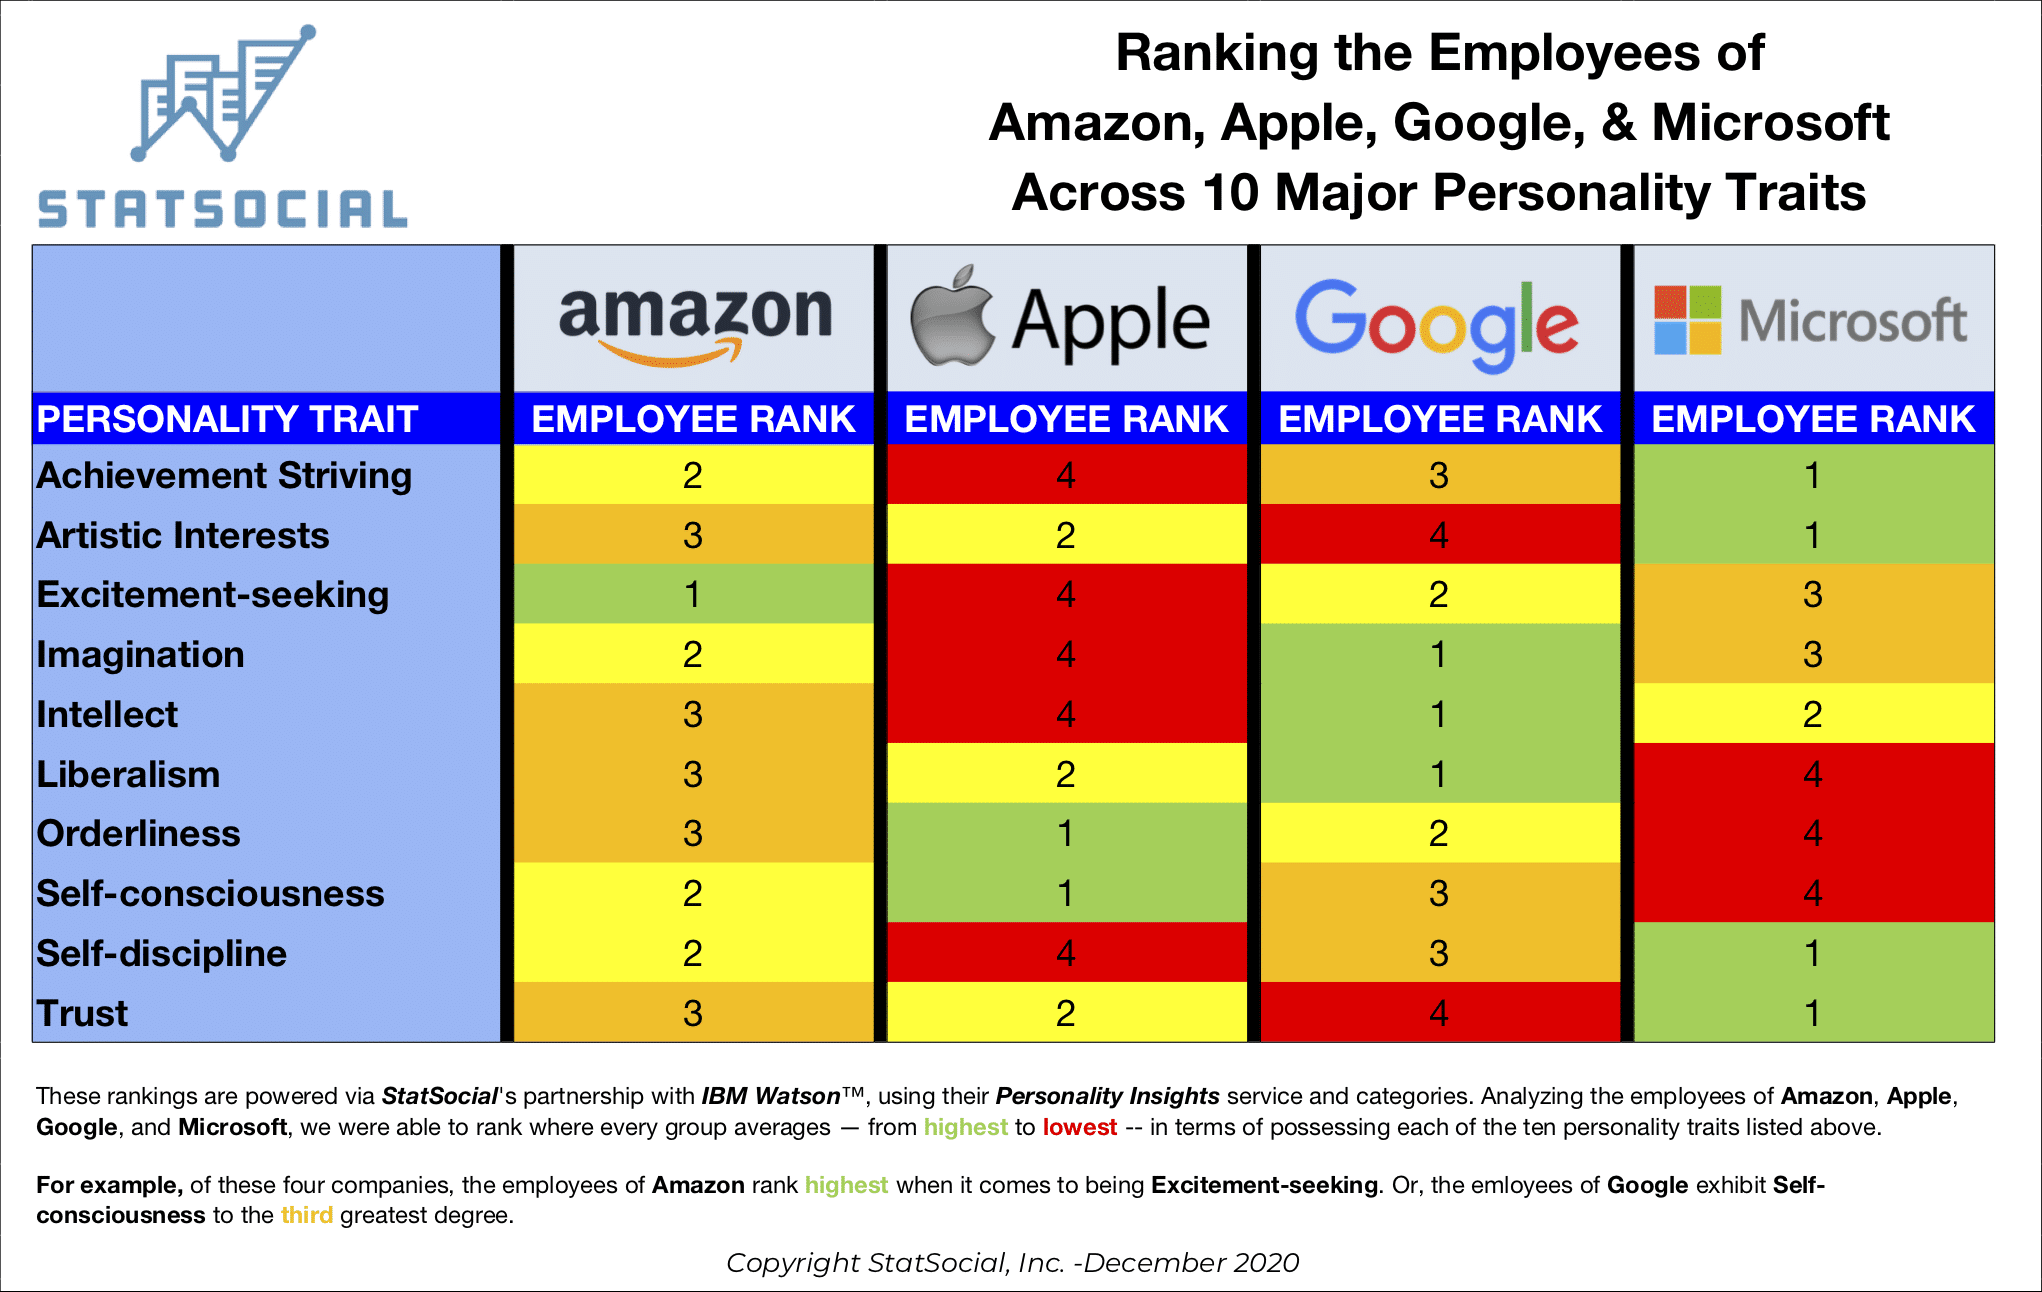
Our Personality Insights are powered by Watson‘s sophisticated AI. When analyzing an individual’s public online writings, Silhouette can infer — with extraordinary and widely-praised accuracy — what personality types dwell within an audience, and in what proportions.
In psychology, the Big 5 personality traits describe a popularly-employed taxonomy that breaks down human personalities into five, broad over-arching categories: Openness, Conscientiousness, Extraversion, Agreeableness, and Neuroticism. Our Personality Insights use this model, with each over-arching umbrella trait housing a number of more granular categories (for example, under Conscientiousness, you will find Cautiousness, Achievement-striving, Dutifulness, and more).
A simple breakdown of the Personality Insights characteristics, and a thumbnail description of each, can be found here. A blog explaining things a bit more in depth can be found here.
The below graphic regards the employees of these Big Tech titans through the lenses of 10 particular characteristics: Achievement-striving, Artistic Interests, Imagination, Intellect, Liberalism, Orderliness, Self-consciousness, Self-discipline, and Trust. We’ve ranked each group, from 1 to 4, indicating which, on average, is most, less, or least likely to exhibit each trait.
——————————————————————————————
How StatSocial Works
INSIGHTS
When trying to convey the depth, breadth, and scale of StatSocial‘s Social Affinity and Earned Media data, we sum it up like this: Imagine an 85,000 question survey given out to 300 million consumers. Now, imagine this already incredible thing as a living, dynamic data set. This survey is being administered in real time, constantly, being continually refreshed to include all of the most up-to-date opinions, choices, affinities, and actions. Learn more here.
ATTRIBUTION
Marketers and media-sellers know that Earned Media and Influencer Marketing are valuable components of their campaigns. Attributing a definitive worth to either, however, has traditionally been elusive. As StatSocial’s analyses report of with what topics and influencers an audience’s members have been engaging, a marketer can now directly attribute website and offline conversions. The same metrics that marketers have long relied upon to quantify the value of a campaign’s Paid and Owned Media components, are now just as readily available for Earned Media. Learn more here.
ACTIVATION
StatSocial‘s vast and comprehensive taxonomy is accessible across every programmatic platform. Our partnership with Liveramp, and direct integrations with such leading platforms as Viant, Oracle Data Cloud, Eyeota, and Lotame, finds StatSocial‘s insights available everywhere you access audience data. We are also available, via our 24/7 online to get you the insights and audiences you need, when you need them. Learn more here.

by StatSocial | Dec 3, 2020
Today we are unveiling something brand new for StatSocial — a mountain of B2B data married to our patented identity graph and audience intelligence platformSilhouette. All of this is ready to be leveraged across our key use cases (insights, attribution, and activation). This is an unprecedented opportunity for B2B marketers to analyze more than 40 million business people, including the companies they work for, industries they work in, and job titles, all cross-referenced against Silhouette’s industry-leading insights.
To demonstrate the power of B2B audience data inside of Silhouette, we’ll be sharing a series of entries comparing the employees of tech giants Amazon, Apple, Google, and Microsoft. If you’d like to see similar insights on other B2B data-sets, please contact us.
It makes sense to begin with the fundamentals, the gender and age breakdowns of the employee bases across these four tech giants. This analysis was completed by analyzing over 30K employees from each company.
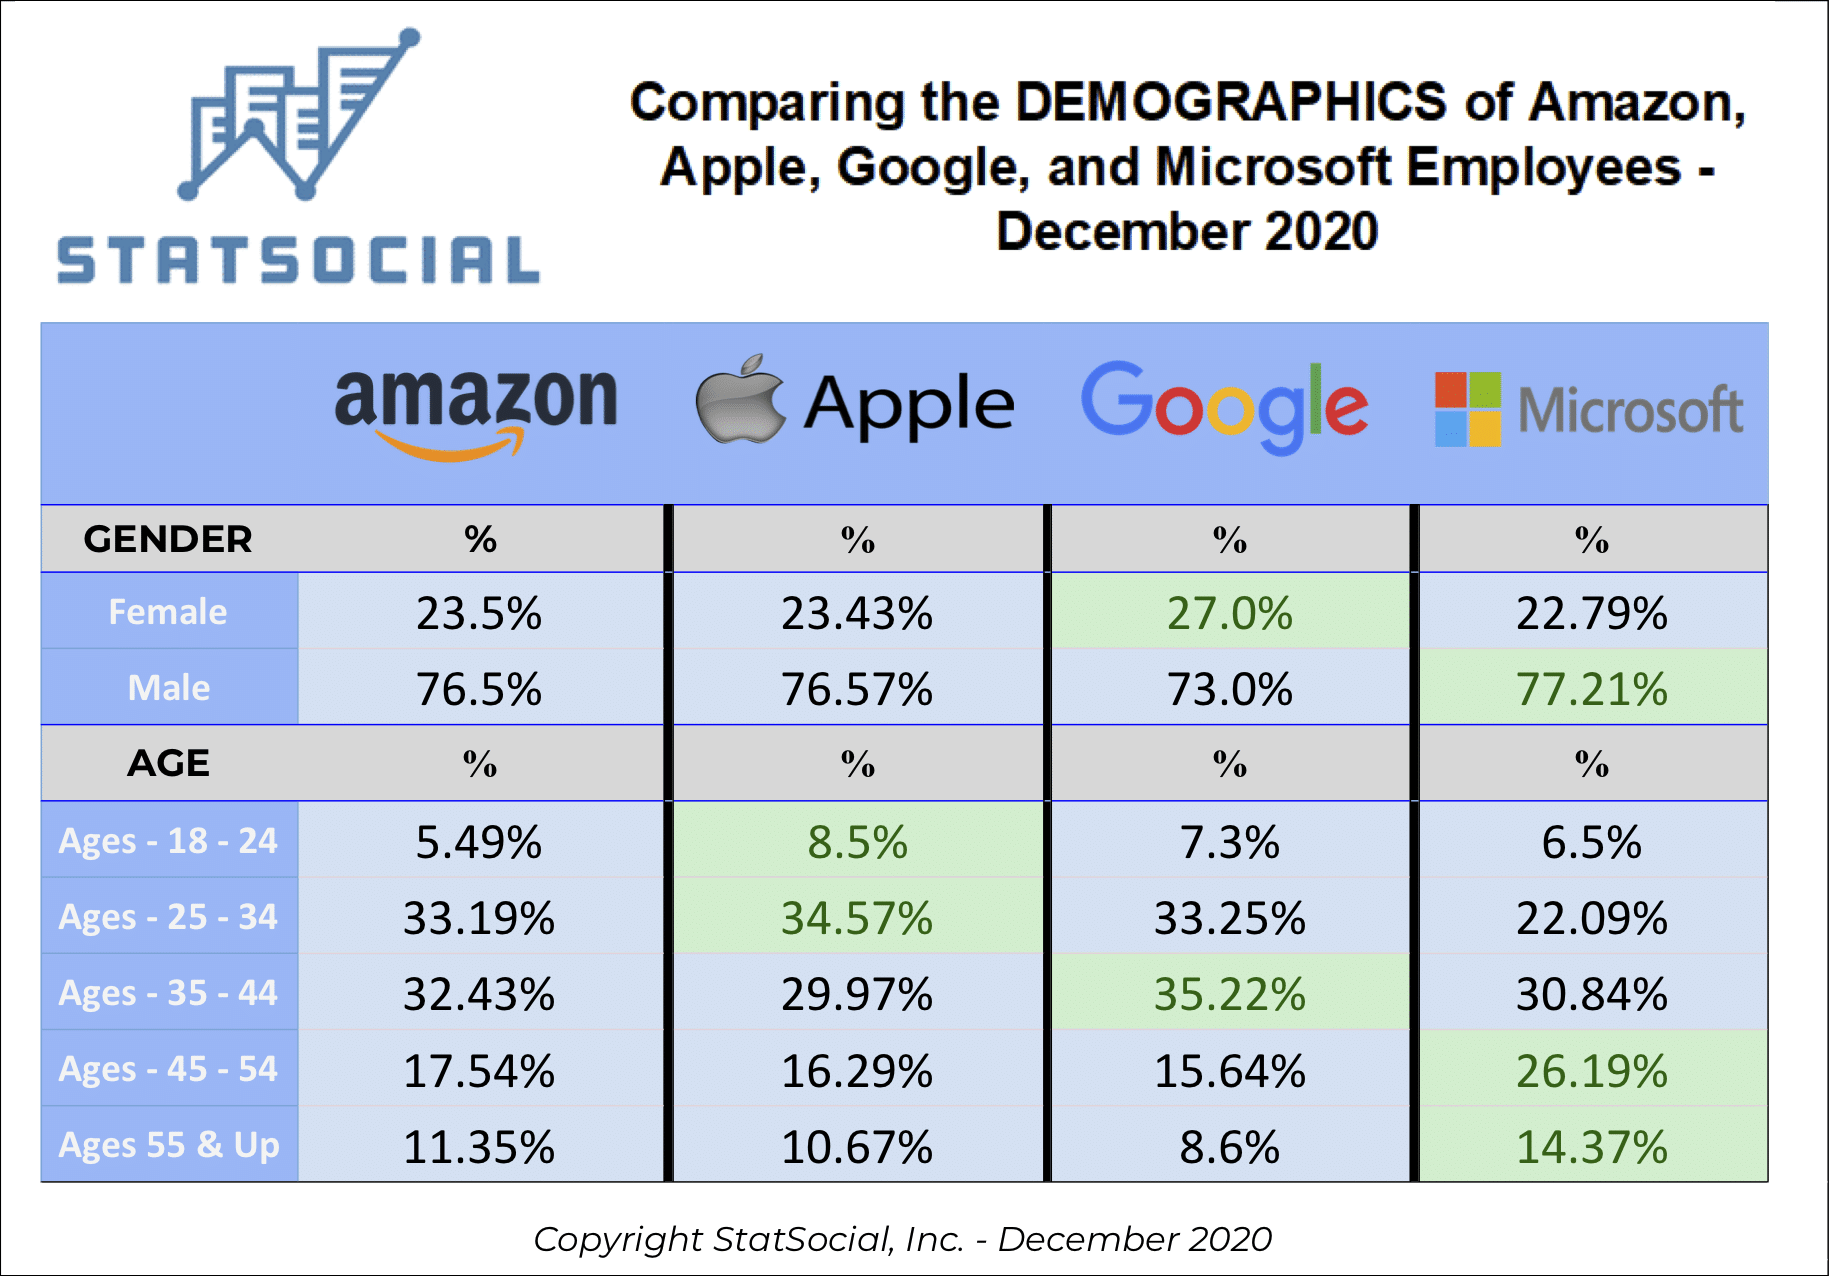
Starting with gender, we know we won’t be shattering any illusions by reporting that each group of employees leans heavily male. In the cases of Amazon, Apple, and Microsoft, women account for less than ¼ of the audiences under our microscope.
Google‘s employees, however, are 27% female.
Next up, ages. Of the four groups, Apple‘s employees contain the largest segment between 18 and 24. The generally younger staffs working at their celebrated and influential retail stores may be a factor. Wherever they may work, however, the company itself reports that over ⅓ of their employees are under 30.
As stated above, and with this much established, we will be digging deeper into these audiences, now that we know the basics. You will be able to find further entries at the B2B tag on our insights blog, and if you want to dive deeper into StatSocial and Silhouette beyond the B2B, you’re invited to peruse the greater insights blog in general.
——————————————————————————————
How It Works
INSIGHTS
When trying to convey the depth, breadth, and scale of StatSocial‘s Social Affinity and Earned Media data, we sum it up like this: Imagine an 85,000 question survey given out to 300 million consumers. Now, imagine this already incredible thing as a living, dynamic data set. This survey is being administered in real time, constantly, being continually refreshed to include all of the most up-to-date opinions, choices, affinities, and actions. Learn more here.
ATTRIBUTION
Marketers and media-sellers know that Earned Media and Influencer Marketing are valuable components of their campaigns. Attributing a definitive worth to either, however, has traditionally been elusive. As StatSocial’s analyses report of with what topics and influencers an audience’s members have been engaging, a marketer can now directly attribute website and offline conversions. The same metrics that marketers have long relied upon to quantify the value of a campaign’s Paid and Owned Media components, are now just as readily available for Earned Media. Learn more here.
ACTIVATION
StatSocial‘s vast and comprehensive taxonomy is accessible across every programmatic platform. Our partnership with Liveramp, and direct integrations with such leading platforms as Viant, Oracle Data Cloud, Eyeota, and Lotame, finds StatSocial‘s insights available everywhere you access audience data. We are also available, via our 24/7 online to get you the insights and audiences you need, when you need them. Learn more here.
by StatSocial | Nov 11, 2020
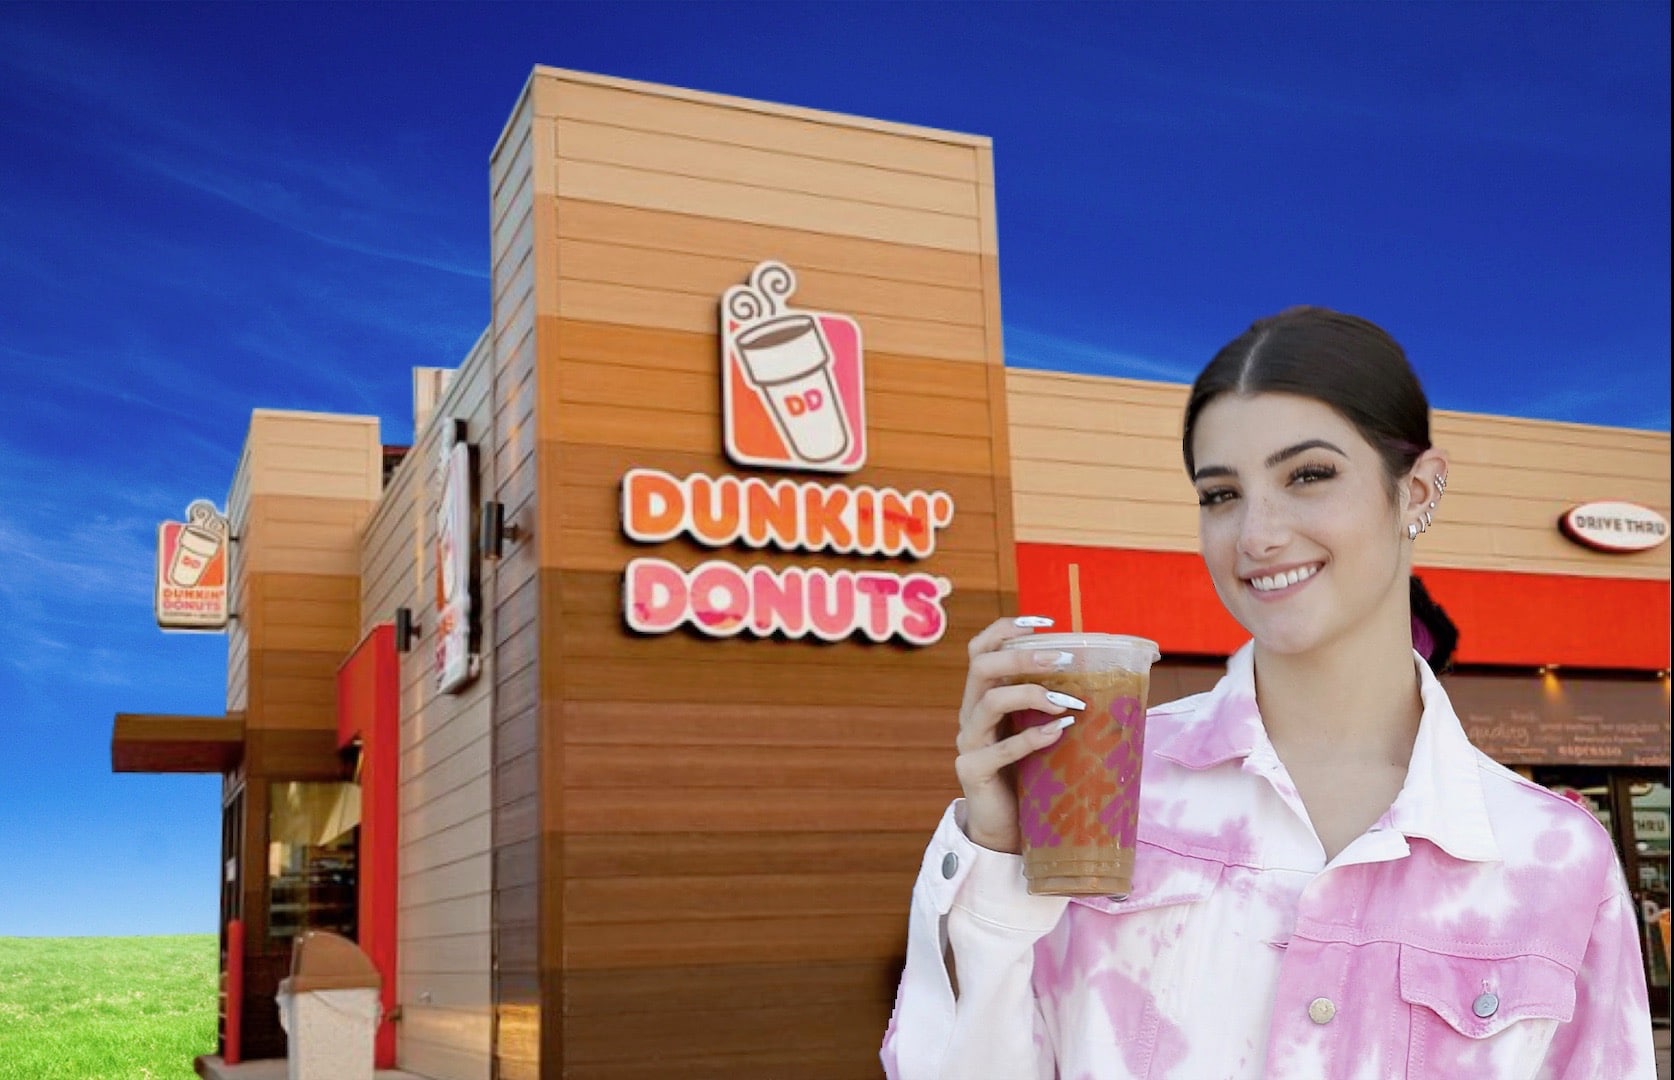
It has been widely reported is that the campaign has been a success, with the drink selling like crazy, and Dunkin’ seeing a 57% increase in downloads of their mobile app. But how much $ are Charli‘s fans spending at Dunkin’ now? That’s what StatSocial can uniquely answer.
StatSocial took a look at the data surrounding Charli’s social audience and Dunkin’s customers. We analyzed the buying behaviors of these two groups, first from over the past 12 months, and then focusing on those purchases made during the campaign’s duration (September 2020). By comparing Charli‘s fans to this control group, StatSocial has shown that there’s been a significant sales lift within Charli‘s social audience.
HOW STATSOCIAL MEASURED THE SALES IMPACT FOR CHARLI’S DUNKIN’ CAMPAIGN
To generate an influencer attribution use case, you need a few different data points to bring together:
- Dunkin’ U.S. Sales Data for the past twelve months
- Dunkin’ U.S. Sales Data for the month of September (the 30 days during which the campaign was live)
- Charli‘s social audience (people who follow and engage with her across her social channels)
- A control audience (the average social media user who is not a Charli fan)
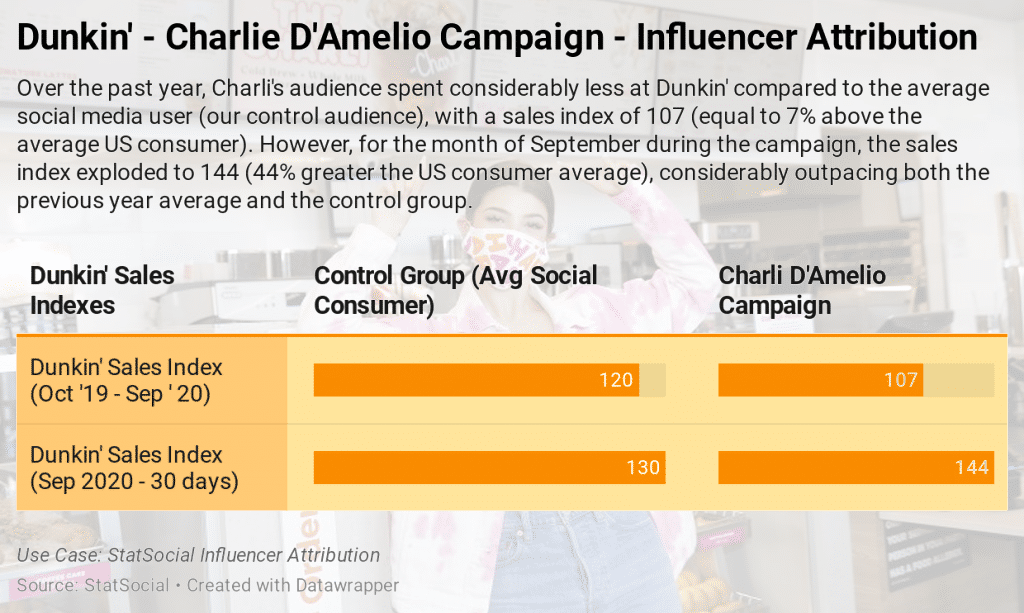
We start by overlaying and indexing the control audience with Dunkin’ sales data for both the past year and the month of September. What we found is that there was a natural lift in the month of September for the average U.S. consumer on social, with a sales index of 120 over the year preceding the campaign’s launch (20% more than the average U.S. consumer) increasing to an index of 130 in September. This increase is possibly due to seasonal effects — people tend to buy more coffee and donuts as the weather cools down.
The next step in our analysis requires us to compare the control group above to Charli‘s fan’s behaviors when it comes to spending their money on Dunkin’. Over the 12 months prior to the launch of the promotion, Charli‘s fans spent considerably less on Dunkin’ than the average social user (our control audience, as noted above), with a sales index of 107 (7% above the average U.S. consumer). However, for the month of September, her fan’s sales index exploded to an index of 144 (44% greater than the U.S. consumer average), considerably outpacing both the average for the previous year, and the control group.
——————————————————————————————
How It Works
INSIGHTS
When trying to convey the depth, breadth, and scale of StatSocial‘s Social Affinity and Earned Media data, we sum it up like this: Imagine an 85,000 question survey given out to 300 million consumers. Now, imagine this already incredible thing as a living, dynamic data set. This survey is being administered in real time, constantly, being continually refreshed to include all of the most up-to-date opinions, choices, affinities, and actions. Learn more here.
ATTRIBUTION
Marketers and media-sellers know that Earned Media and Influencer Marketing are valuable components of their campaigns. Attributing a definitive worth to either, however, has traditionally been elusive. As StatSocial’s analyses report of with topics and influencers an audience’s members have been engaging, a marketer can now directly attribute website and offline conversions. The same metrics that marketers have long relied upon to quantify the value of a campaign’s Paid and Owned Media components, are now just as readily available for Earned Media. Learn more here.
ACTIVATION
StatSocial‘s vast and comprehensive taxonomy is accessible across every programmatic platform. Our partnership with Liveramp, and direct integrations with such leading platforms as Viant, Oracle Data Cloud,Eyeota, and Lotame, finds StatSocial‘s insights available everywhere you access audience data. We are also available, via our 24/7 online to get you the insights and audiences you need, when you need them. Learn more here.