For this study, StatSocial executed a side-by-side-by-side analysis of the three giants of the Platform-as-a-Service/Infrastructure-as-a-Service sector: Microsoft Azure, Amazon Web Services, and Google Cloud Platform.
By analyzing the data generated by the most dedicated users of the three platforms, we can ascertain where each service’s customers’ priorities reside, and in turn where each is strongest. In this hyper-aggressive space — where these three tech behemoths are vying to be the definitive market leader, and with the needs for these services only increasing for the foreseeable future — these insights could be the key to having the competitive edge.
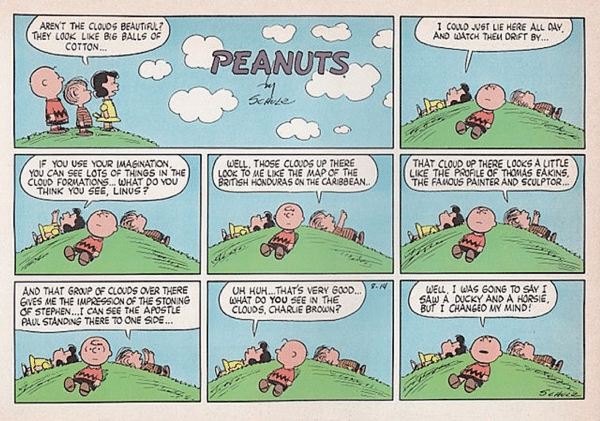
When gazing up at the skies on a beautiful summer’s day, the shape of the clouds will recall for different people any number of things. Maybe a puppy, or perhaps — as is the case for Linus in the comic strip featured here — the stoning of St. Stephen.
There is an objective truth about what clouds are, though; water droplets and ice crystals formed when the temperature of rising air cools below the dew point.
There is an objective truth about the clouds upon which we’ll be gazing in this entry as well. By now, you probably know the meme…
While we’re left to assume that the bit about the dew point is failing to grasp the nuance, or even the poetry, of the thing, so too is the description in the above graphic desperately wanting. Certainly, at least, if we’re discussing cloud computing’s three biggest names: Microsoft Azure, Amazon Web Services, and Google Cloud Platform.
A Quick Summary of the Market
Amazon Web Services
As of this writing, Amazon leads this sector somewhat confidently. A Synergy Research Group study from 2018 reported that AWS’ market share has held steady at around 33% for 12 consecutive quarters.
AWS’ growth has continued in keeping with the cloud computing sector itself, even as said sector has tripled in size in recent years.
Microsoft Azure
Comparable newcomer (at least relative to Amazon’s over ten years in the game), Microsoft Azure, has been coming up the rear, and quickly. With the vast majority of American businesses running on Microsoft software, they entered the market with a strong calling card.
Microsoft’s virtual machines are not strictly for Windows parties, however. They also support Linux, Oracle, IBM, SAP, and so on.
One perk of Azure that is oft cited is an eagerness to cater to enterprises seeking a “hybrid cloud” solution. For many companies, handing over all data and infrastructure to a public cloud — and its accompanying support — is not wise, and is often not an option. Retaining some on-premises systems is crucial for many enterprises for reasons ranging from scalability to security, and beyond.
Azure boasts support that is prepared to integrate, and cooperate, with a company’s own data center. The size of AWS being what it is, accommodating hybrid systems is not a priority, and thus far it hasn’t had to be.
Google Cloud
Google’s entry into this area, late-arriving though it may be, has thus far found them growing quickly into their third place slot. The services they currently have on offer are not as robust and extensive as the two platforms addressed above, but what they do they do excellently, and rather affordably. Google has, to this point, not been so focused on catering specifically to enterprise demand, instead providing ground-up computing solutions for customers with needs of quite varied sizes. They do this, also, bringing to the table Google’s engineering expertise, as well as their substantial AI, analytics, and machine learning capabilities.
On Earned/Social Audience Data
A bit of an explanation of what the comparisons in this entry are about, and how we calculated them.
StatSocial’s data is culled from the earned engagement data (e.g. what people read, like, follow, share, talk about, etc.) of over 300 million consumers. Our analysis of all the content people engage with creates over 80,000 unique attributes per consumer. As a result, we provide an in-depth breakdown of an audience’s interests, affinities, media preferences, hobbies, allegiances, to which of our Digital Tribes they belong, and thanks to our partnership with IBM Watson™ and the integration of their Personality Insights™ service into our analysis, even personality types.
Our reporting reveals things that could not feasibly be learned through hundreds or, truthfully, hundreds of thousands of surveys and focus groups. StatSocial peers beyond the manicured and curated identities of social media, and digs into what really makes the various segments of any given audience tick.
While what you’ll find below may seem like a lot of data, it is only the tip of the iceberg of the insights StatSocial has on offer, regarding these (and all other) audiences. That said, we’re experts at tailoring the analysis to our users’ needs, so they’re never overwhelmed by the data.
An Explanation of the Insights Below:
The insights below are mostly sorted according to our index score. The score shows the degree to which the corresponding demographics, behaviors, and/or affinities being reported either exceed, are in line with, or fall short of the baseline. For this study, the baseline we’re using is the average American social media audience.
— — — —
DEMOGRAPHICS
The best place to start is usually at the beginning, and that’s just about where we are here.
Let’s get to know these groups of dedicated customers, first, by digging into some of the basic, fundamental stats behind each.
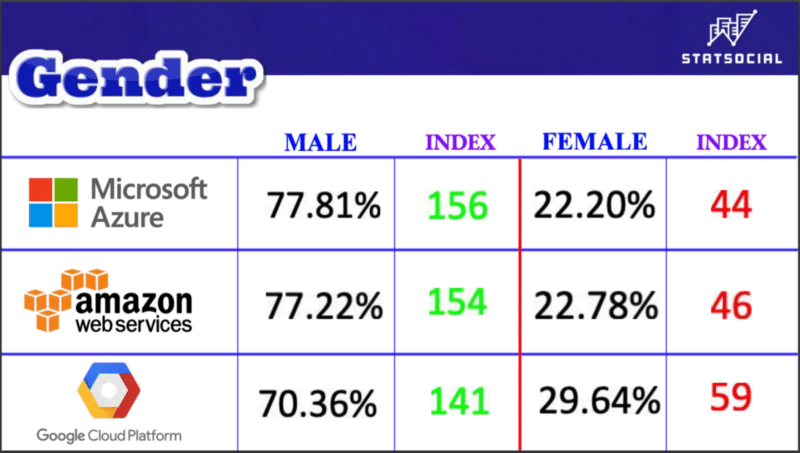
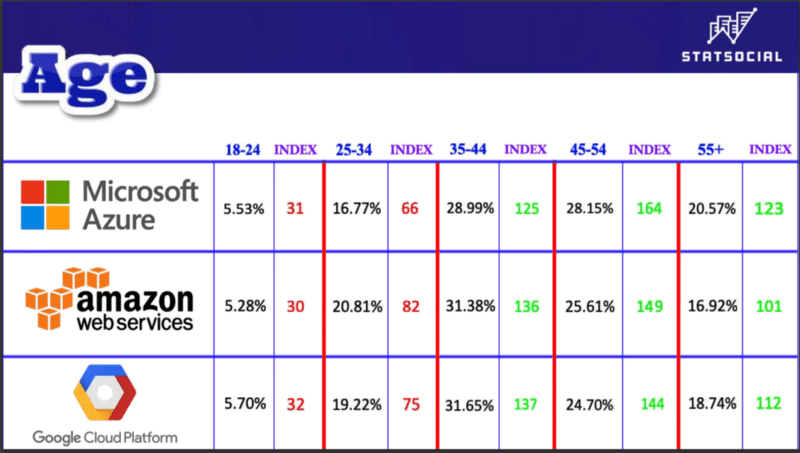
EXPLANATION: The percentages represent the actual percentage of each audience listed above that accounts for the corresponding column header. The index score reflects the degree to which that percentage is in excess of, is in line with, or falls short of our baseline (here, the average American social media audience). So, 77.81% of Microsoft Azure’s audience is male. This exceeds the baseline by 1.56 times.
Google Cloud’s female customer-base is proportionally a fair bit larger than that of the other two platforms. All are clearly majority male, but with these being the numbers, Google does seem to be attracting more clients with women in developer, infrastructure, and database management roles.
In keeping with what is explained in the caption to the previous graphic, 28.15% of Microsoft Azure’s customers are between ages 45 and 54. This percentage over-indexes our baseline by 1.64 times.
All three of these groups skew comfortably older than the average American online audience. Microsoft Azure’s customers are the most seasoned out of this bunch, with those over age 55 exceeding the baseline by nearly 1 ¼ times.
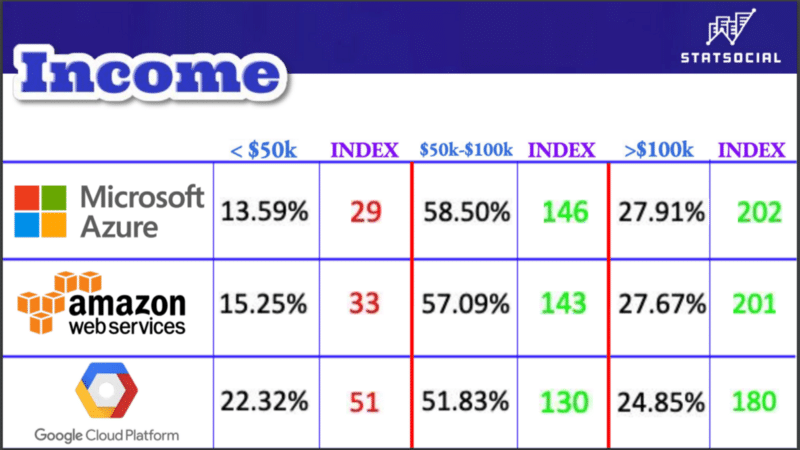
Again, consistent with the explanations captioning the two graphics prior to this, 27.91% of Microsoft Azure’s customers earn $100k a year or more. This quantity over-indexes our baseline by 2.02 times.
As with many StatSocial insights, a question raised by one statistic will be answered or given context by another. Even lacking that clarity here, however, it can be observed that when the lowest earning of the audiences being examined contains a nearly 77% segment earning $50k a year or more, you are looking at a bunch of well-paid audiences.
— — — —
LOCATIONS
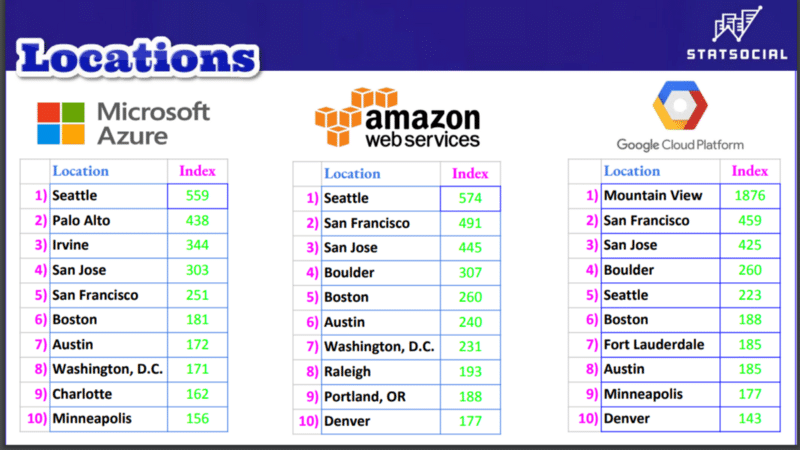
Given that the largest number of clients for these services will be centered in a handful of cities above all others, this seemed a set of data worth including.
First, the basic numbers.
Microsoft Azure customers who reside in San Jose exceed the quantity found among the average American social media audience by 5.59 times. The portion of Google Cloud Platform customers who reside in Minneapolis over-index the baseline by 1.77 times.
The northwestern tech-hubs you’d expect are accounted for, as are those cities that are more peculiar to one of the companies over the others.
Any city that Amazon Web Services’ customers call home in large numbers, also finds Amazon’s audience as the most over-indexed of the three being looked at. This is, perhaps, most noteworthy in the case of Seattle, a town that genuinely is what it is today, to a decent degree, because of Microsoft. Fear not, though, things even out as we progress.
— — — —
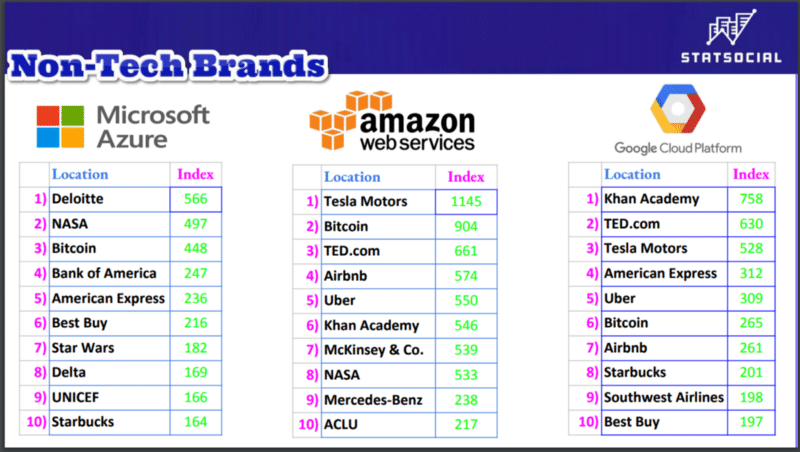
BRANDS
The extent to which tech-brands — manufacturers of computers, mobile devices, softwares, and providers of things such as, oh, say, cloud computing services — dominated these lists made it seem a wise and fair idea to include a second batch. The non-tech brands deserve their moments in the sun, do they not?
A vital thing to note about StatSocial is that, when going through our reporting, you can home in on a specific set of statistics, getting as granular as you please, or look at a more broad data-set (like, say, “brands” in general).
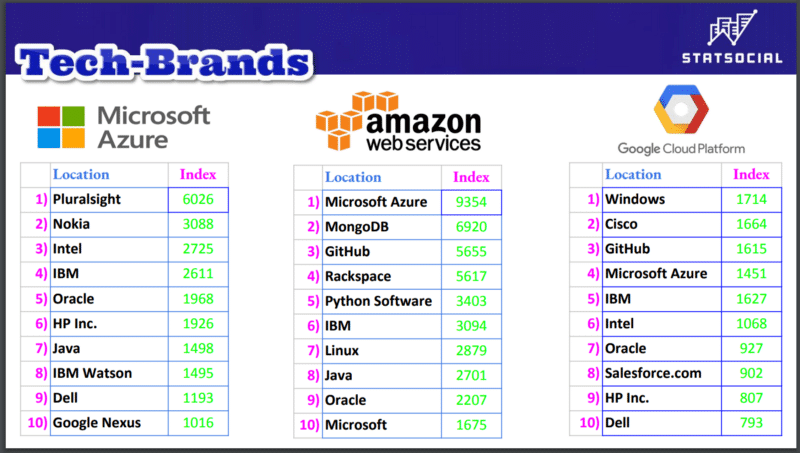
Let’s start with those tech brands.
As all the preceding graphics’ captions have hopefully made clear by now, Microsoft Azure’s customers are also interested in Nokia to a degree that exceeds what you’d find among the average U.S. social media audience by 30.88 times.
Each platform was the number one brand with its own customers. As you’d expect. So, the number ones listed above are actually the number twos. But would you look at who’s atop the list of brands most popular with Amazon Web Services’ most dedicated customers? Microsoft Azure; also the number four brand among Google’s customers.
While the below lists have rather techie non-tech brands upon them, we believe where and how we made the distinctions should be rather clear.
— — — —
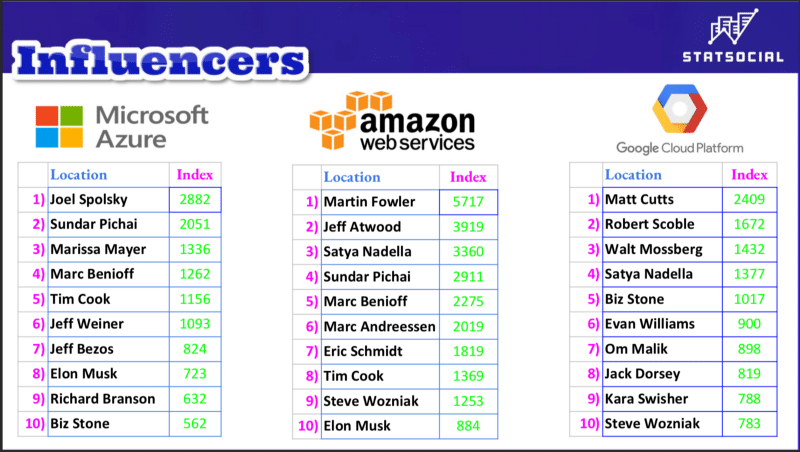
INFLUENCERS
None of us are raised in a vacuum. Wouldn’t we suffocate?
They like the influencers listed below, though, and they pay attention to them. Also, a narrative established virtually from word “go” of this study is now confirmed beyond doubt, these gatherings of devoted customers are way into tech stuff.
— — — —
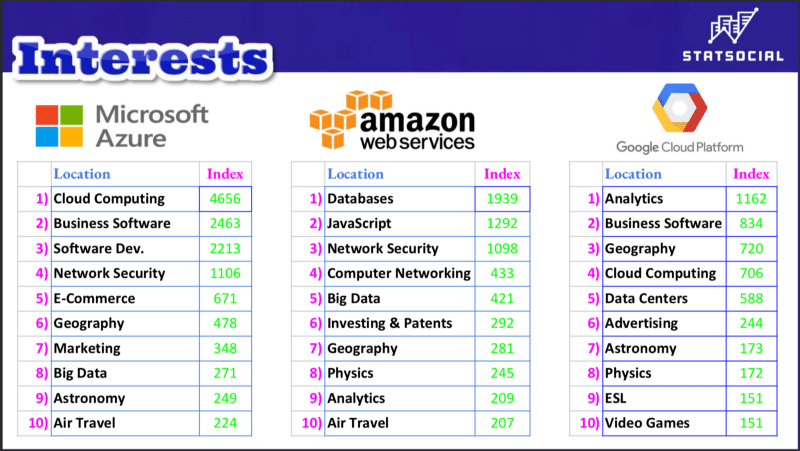
INTERESTS
While few are bereft of influence, virtually no one is entirely disinterested in all things.
The combination of interests below takes things to places that might not be entirely expected (geography, for example, which is useful, incidentally, if you’re taking things to places). But, you’ve got to confess, the below lists don’t precisely buck expectation. They do, however, illustrate that the StatSocial instruments are calibrated correctly.
We also, incidentally, can promise you that as you descend any one of these lists, more and more surprises will emerge. Hit us up for a demo, and learn precisely what types of surprises…
But wait, we’re not quite there yet.
— — — —
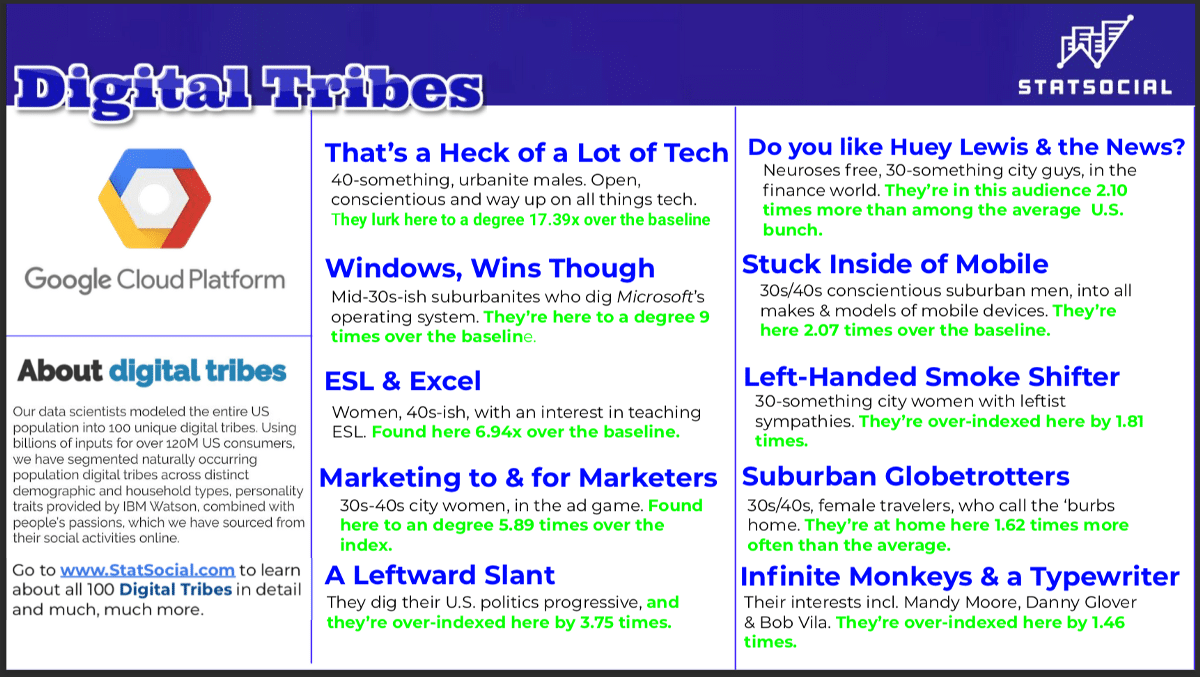
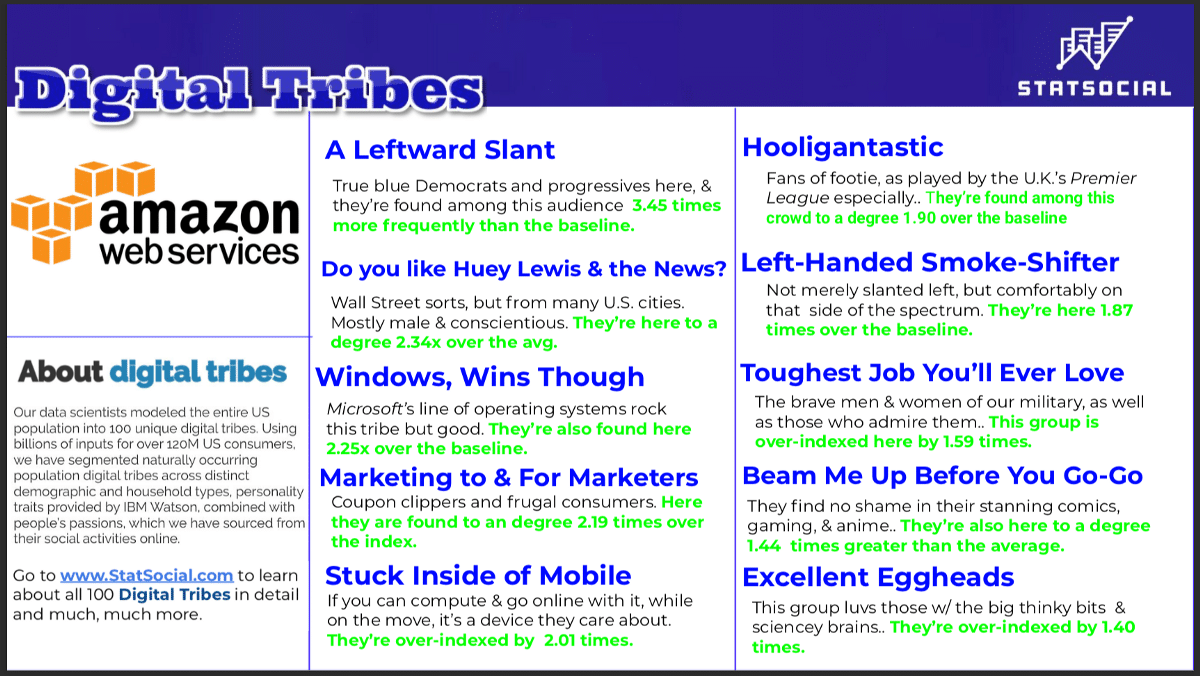
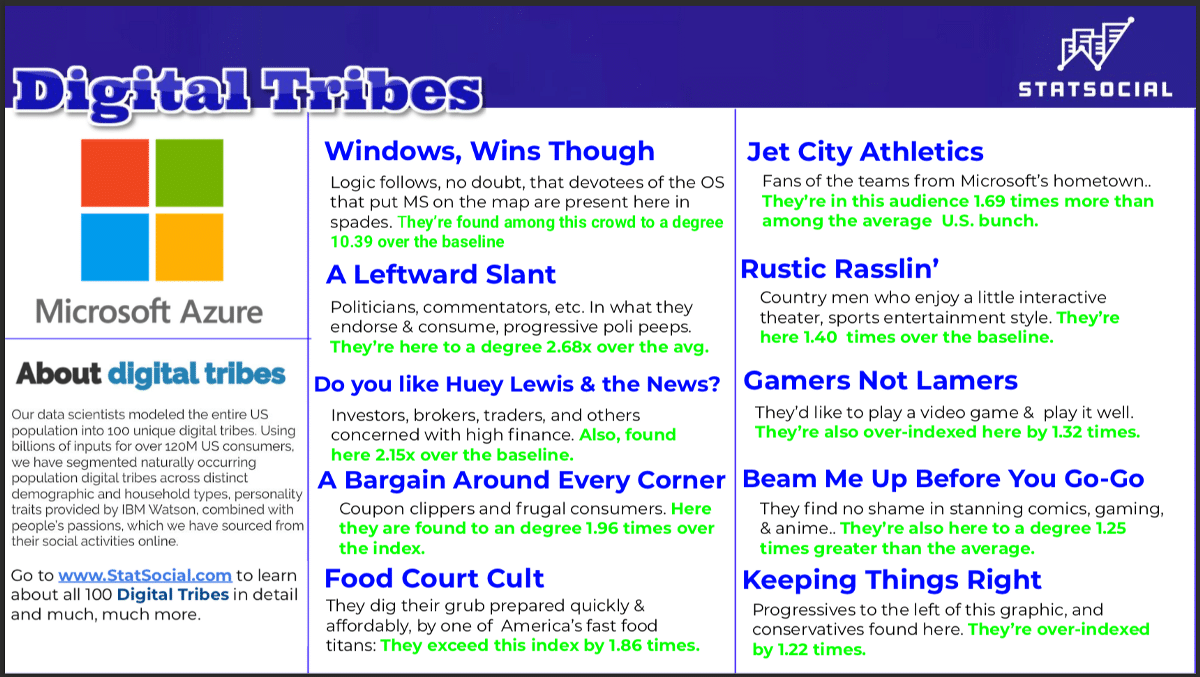
DIGITAL TRIBES
You can read a blog entry detailing this very special set of data by clicking this link, but we’ll also summarize things here.
StatSocial Digital Tribes is a model of the U.S. population broken down into 100 distinct market segments. Seeing which Tribes are present, and in what proportions, grants our users quick, crucial, and unprecedented insight into the humans who make up a given audience.
Combining our demographic and affinity data, with our Personality Insights® (powered by IBM Watson), we have been able to gather these utterly singular segmentation models. Both sides of the data coin are factored in — the demographic and the psychographic — enabling StatSocial to provide brands, publishers, media buyers, and agencies a comprehensive, in-depth understanding of their target audiences.
The three graphics below show the 10 best represented Tribes among each of the audiences being explored here. An ever-so-brief summary of the shared affinities, demographics, and/or personalities of each tribe is then provided.
More in-depth descriptions of each Tribe referenced below, and the remainder of our 100 Digital Tribes can be seen by clicking here.
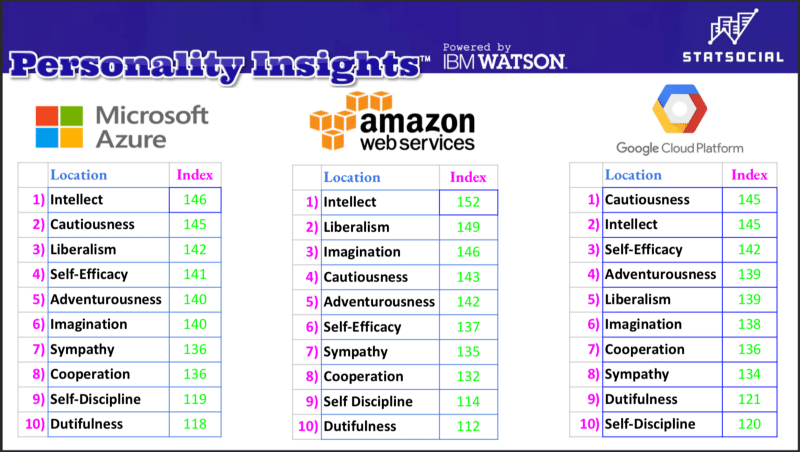
Among the great many things StatSocial will tell you about any audience, one of the most distinctive, revealing, and essential, is a breakdown of the various personality types to be found among any audience being explored.
Thanks to StatSocial’s proud partnership with IBM Watson™ and the integration of their Personality Insights™ service into our reporting we can report on 52 unique personality traits with as much confidence as we do those metrics which to some might seem more concrete.
The broad conclusions are clear, but some more specific stories are told as well. Amazon is the war horse. The current king of the mountain. Microsoft seems to be an increasingly popular choice among those making the increasingly popular decision to pursue a hybrid cloud computing solution for their business.
Google is also growing rapidly, and is providing services a bit distinct from their two biggest competitors.
There’s a great deal more to be learned here, though (or perhaps you’d prefer to learn something directly related to another industry in which you work). Reach out to StatSocial and we’ll gladly talk to you about it.
Insights on top of insights can be found by the curious reader who chooses to poke around the StatSocial blog here. Peruse the many entries, offering all kinds of insights, studies, and deep dives to better acquaint you with the capabilities of StatSocial.
Throughout the blog are many examples of the sorts of insights that can only be gained with StatSocial.
Most members of the news media today also cultivate an online following across social media channels. StatSocial specalizes in analyzing online social media audiences. We analyze tens of thousands of prominent influencers across all major categories, including thousands of members of the news media. Here we have selected nearly 650 members of the news media, analyzed their social audiences, and then scored and ranked the relative political leanings of each member’s audience across political lines – Democrat vs. Republican.
If there is a member of the media you’d like to see added to this list, feel free to drop us a note here or send us a tweet and we’ll do our best to include them in an upcoming revision.
Below you’ll find the weekly update, courtesy of StatSocial’s Crisis Insights service, tracking and ranking each state based on engagement with online discussions of COVID-19.
For those new to Crisis Insights: The subscription service has been built using StatSocial’s Silhouette™ social data platform. The service is a tool for brands, marketers, and agencies seeking to understand the rapidly changing dynamics of their customers who, as a result of the uncertainty born of the COVID-19 pandemic, are finding their customer dynamics shifting during these trying times.
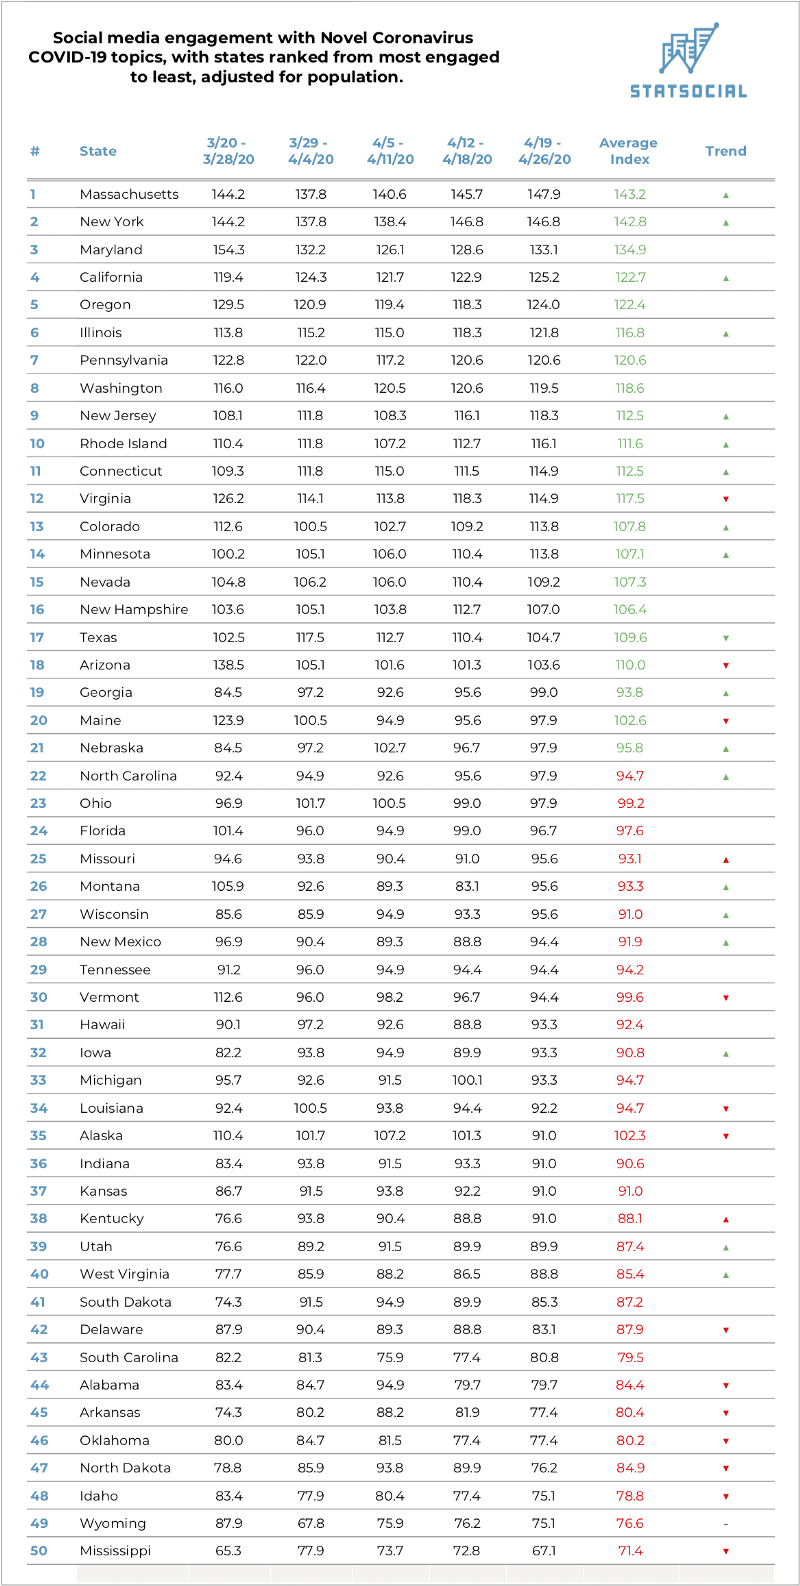
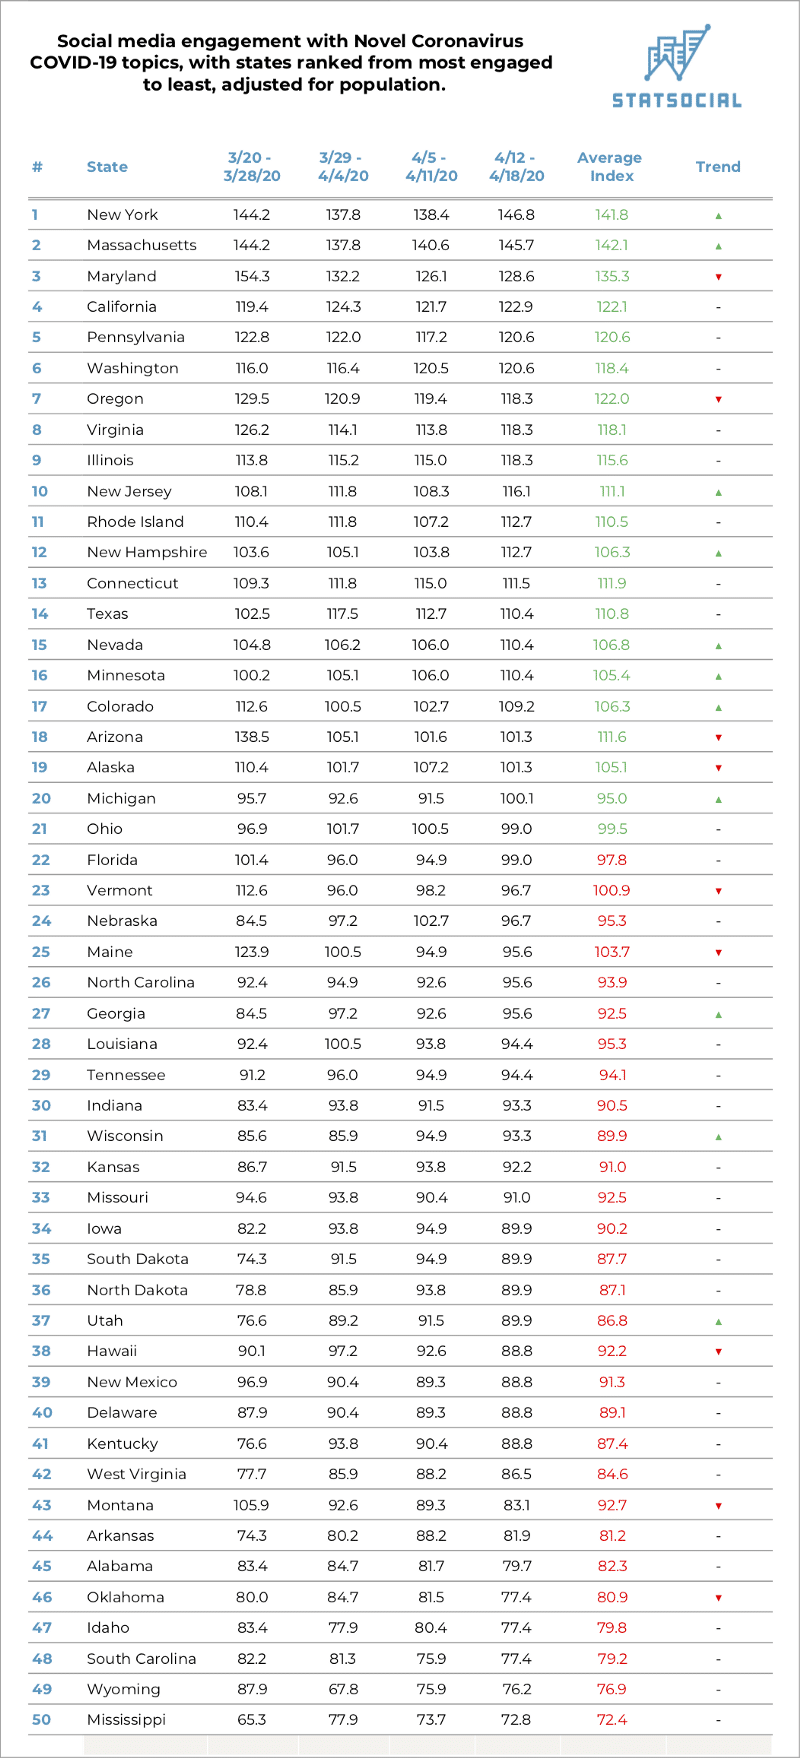
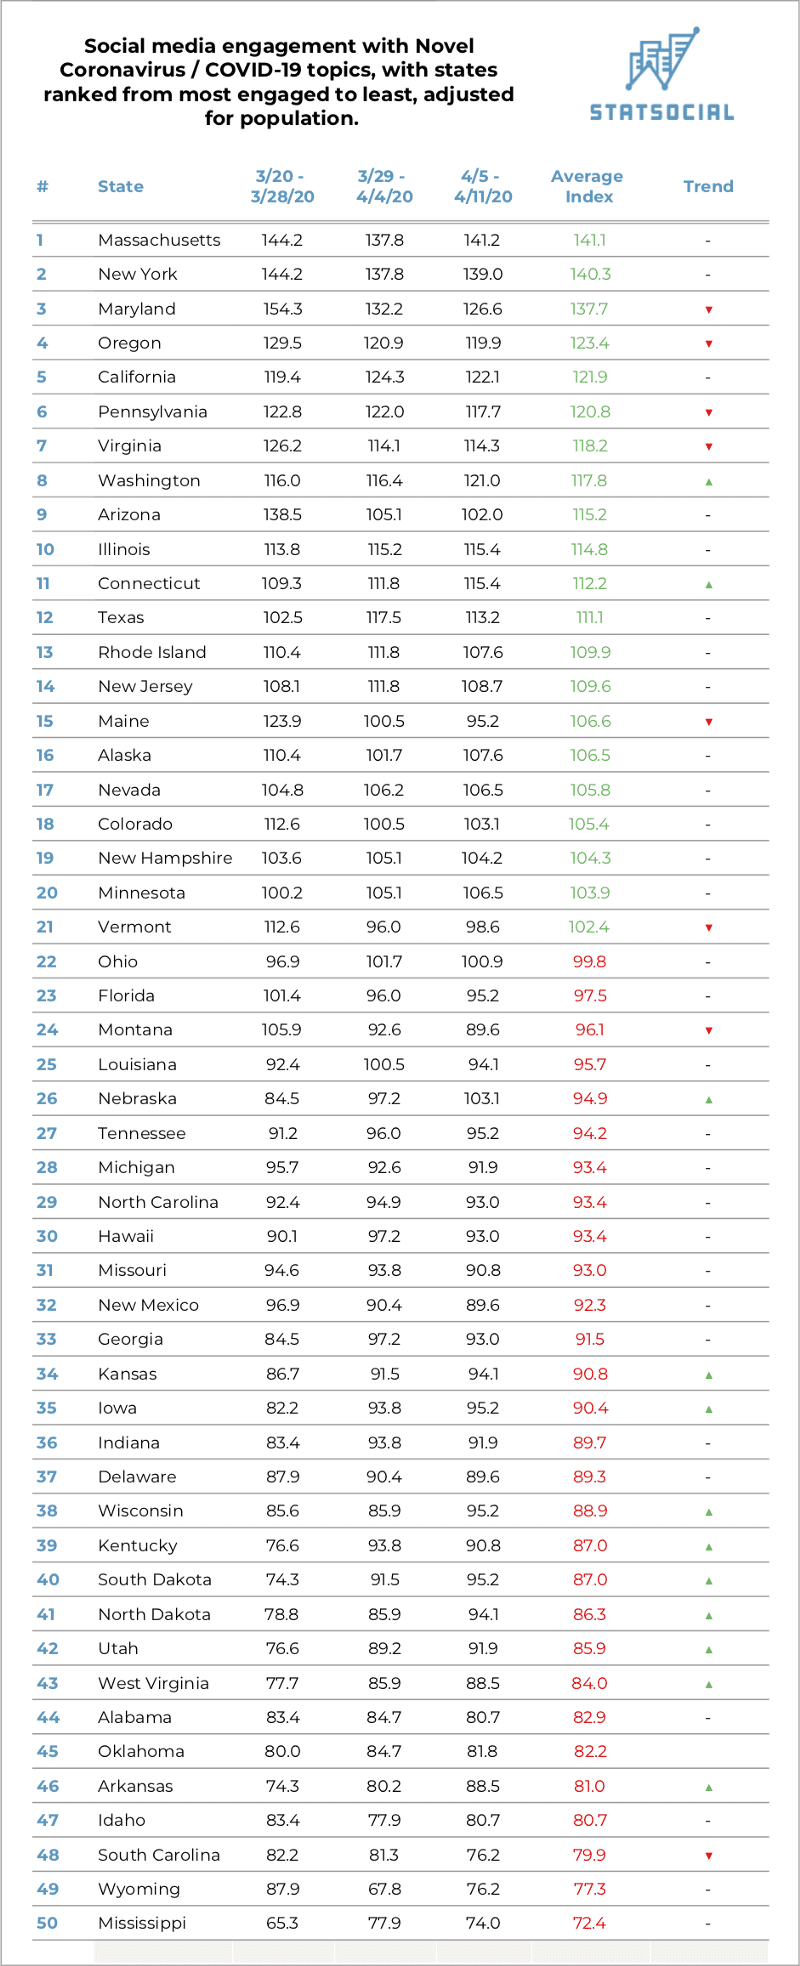
The 50 United States, ranked by online engagement with Novel Coronavirus / COVID-19 topics, from most engaged to least
Explanation of the above data: The scores on the above chart are index scores. Used for convenience here, these scores summarize, at-a-glance, the degrees to which social media content related to novel coronavirus / COVID-19 topics have been engaged with by the residents of each state.
The index scores are calculated based on contrasting the above described statistics with the entire United States population’s engagement with novel coronavirus / COVID-19 topics. A level score of 100 is used to represent this national number, and the scores on the above graphic report the degrees to which each state’s engagement is in excess of or is equal to (represented in green), or falls short of (represented in red) that baseline.
Each state’s engagement has been broken out by week (the first three to have transpired since Crisis Insights’ launch). This allows you to see how engagement has increased, decreased, or held steady week-to-week.
The data used for Crisis Insights’ reporting is collected and analyzed daily, and then reported to subscribers as rolling seven and 30-day averages (as well as a full data series).
In addition to the insights shared here — regarding where each state’s residents stand when it comes to engagement with topics surrounding the COVID-19 matter — this also offers a small glimpse into how our constantly revised, amended, and well-presented reporting allows brands to observe, compare, and retain context for customer behaviors, concerns, affinities, etc., as they shift, change, and are even replaced over the coming weeks and months.
Massachusetts, whose residents have been consistently seeking out and engaging with news, articles, and discussions pertaining to the epidemic, and the many related topics surrounding it, are currently topping the list. Engagement with novel coronavirus/COVID-19 related content has been trending upward.
The Commonwealth has had to deal with the third largest number of confirmed cases, and has endured the fourth largest number of fatalities. Just this past week, the state suffered the highest single-day death toll since the start of the outbreak. They’ve also been battling new, confirmed cases at a rate greater than any other state.
New York, which remains, by a vast margin, the hardest hit state in the country — with over 305,000 residents confirmed to have contracted the virus, and over 23,000 deaths — also finds its citizens consistently engaging with online content related to the whole matter. New Yorkers find their engagement overall trending upward.
While new hospitalizations and, even more gratefully, new deaths from the virus have been, mostly steadily, trending downward, New Yorkers are clearly making a point of remaining vigilant, and staying informed.
Maryland remains notable as engagement with content related to the crisis, at first glance, appears proportionally far larger than the degree to which the state’s residents have been hard hit. The state, though, has still been contending with an overall increasing number of new cases, finding them the third hardest hit state at this moment, in terms of trying to find success with “flattening the curve.”
Alaska, the state with the fourth smallest population in the country, had found its residents rather actively consuming and engaging with online content related to the epidemic, and the many related topics and concerns that have arisen with it. That engagement had been, however, steadily trending downward, and as of this update has really dropped off.
Also dropping off, however, is the number of confirmed cases and fatalities from the virus among Alaskans. The former number is the lowest of all states, and the latter, single-digit figure, one of the very smallest.
The state whose residents are the least engaged with content regarding the the novel coronavirus, COVID-19, and all related matters, remains Mississippi. Notable here, because although the rate at which new cases are being confirmed remains, more or less, steady, engagement with content regarding the topic has dropped off a fair bit, and finds the overall trend a downward one.
What are Crisis Insights?
Crisis Insights provides subscribers with near real-time updates on how the unprecedented climate in which we all find ourselves is affecting consumer sentiment, both among the general public, as well as a brand’s specific customers.
Changes in consumer sentiment are tracked in this reporting, for 32 crisis-related segments, across four general categories:
People concerned about the Covid-19 epidemic
People concerned about the direction of the economy
People coping and adjusting to the ‘new normal’ environment
General attitudes and psychographic outlook of the population
With that we encourage you to continue to revisit the blog for more insights of this nature, including our weekly updates of this chart.
And most importantly, we hope that you and yours are remaining as safe and healthy as your situations allow. Please be well.
We encourage you to visit these previously shared Crisis Insights related posts:
Please note: Many of the data points featured in the below entries will have changed and evolved in the weeks since the entries were first posted (as is the way with our Crisis Insights reporting). We believe these links are still worth checking out as they illustrate more fully the nature of what kinds of statistics Crisis Insights offers, and how they can be put to use meaningfully.
Below you’ll find the weekly update, courtesy of StatSocial’s Crisis Insights service, tracking and ranking each state based on engagement with online discussions of COVID-19.
For those new to Crisis Insights: The subscription service has been built using StatSocial’s Silhouette™ social data platform. The service is a tool for brands, marketers, and agencies seeking to understand the rapidly changing dynamics of their customers who, as a result of the uncertainty born of the COVID-19 pandemic, are finding their customer dynamics shifting during these trying times.
The 50 United States, ranked by online engagement with Novel Coronavirus / COVID-19 topics, from most engaged to least
Explanation of the above data: The scores on the above chart are index scores. Used for convenience here, these scores summarize, at-a-glance, the degrees to which social media content related to novel coronavirus / COVID-19 topics have been engaged with by the residents of each state.
The index scores are calculated based on contrasting the above described statistics with the entire United States population’s engagement with novel coronavirus / COVID-19 topics. A level score of 100 is used to represent this national number, and the scores on the above graphic report the degrees to which each state’s engagement is in excess of or is equal to (represented in green), or falls short of (represented in red) that baseline.
Each state’s engagement has been broken out by week (the first three to have transpired since Crisis Insights’ launch). This allows you to see how engagement has increased, decreased, or held steady week-to-week.
The data used for Crisis Insights’ reporting is collected and analyzed daily, and then reported to subscribers as rolling seven and 30-day averages (as well as a full data series).
In addition to the insights shared here — regarding where each state’s residents stand when it comes to engagement with topics surrounding the COVID-19 matter — this also offers a small glimpse into how our constantly revised, amended, and well-presented reporting allows brands to observe, compare, and retain context for customer behaviors, concerns, affinities, etc., as they shift, change, and are even replaced over the coming weeks and months.
The top ranked state this week is the state StatSocial calls home, and the one hardest hit by the virus (both in terms of diagnosed cases and fatalities). For residents of New York, and especially New York City, there is a very real need to keep up to date on the day-to-day developments around the virus, and the sharp economic downturn that came along with its arrival. This news is of importance to everyone right now, of course, but there is an additional practical urgency for New York’s residents.
This is why its not at all surprising to see that, while topping the list, consumption of discussion and content related to the Novel Coronavirus crisis is only trending upward among the state’s citizens.
As of this week, the degree of engagement among the Empire State’s residents exceeds the national average by 1.418 times. The week of 4/12 to 4/18/20 has seen found the state consuming, interacting, and/or engaging with COVID-19 related content to the greatest degree to date.
Massachusetts (the top ranked state last week) is ranked second here. The state’s citizens have been engaging with online content pertaining to the virus, and all related matters, to a degree exceeding the baseline by 1.412 times.
The week of 4/12 to 4/18/20 was the state’s highest week of engagement to date, and in an overall way the state’s engagement is trending upward.
Maryland — the state with the 13th most diagnosed cases, 7th most confirmed deaths — is ranked 3rd here, but engagement has been steadily trending downward.
Michigan experienced the third largest number of new fatalities last week (after New York and New Jersey), and has also contended with the third largest number overall. Engagement among the state’s residents is trending upward,
Utah, the state with the 30th most diagnosed cases (and 29th most new cases as of the past week), and 44th highest number of confirmed deaths from the virus, finds its engagement overall trending upward. The state’s week of highest engagement to date was the week of 4/5 to 4/11/20.
Mississippi, retains its position as the state with the lowest degree of engagement from last week. Averaging the engagement trends of the last three weeks indicated on the above chart shows that engagement has been trending downward, with the week of 4/12 to 4/18/20 showing an especially sharp increase.
Wisconsin, which is ranked 31st above, finds engagement among its residents decidedly trending upward. To date, the state has the 26th largest number of overall diagnosed cases and the 19th largest number of confirmed fatalities.
We eagerly invite you to visit our Crisis Insights page here, and to reach out to us to learn a great deal more about the service, and to check out a demo.
As before, and as always, we sincerely hope that all reading are doing as well as circumstances allow, and are safe.
What are Crisis Insights?
Crisis Insights provides subscribers with near real-time updates on how the unprecedented climate in which we all find ourselves is affecting consumer sentiment, both among the general public, as well as a brand’s specific customers.
Changes in consumer sentiment are tracked in this reporting, for 32 crisis-related segments, across four general categories:
People concerned about the Covid-19 epidemic
People concerned about the direction of the economy
People coping and adjusting to the ‘new normal’ environment
General attitudes and psychographic outlook of the population
With that we encourage you to continue to revisit the blog for more insights of this nature, including our weekly updates of this chart.
And most importantly, we hope that you and yours are remaining as safe and healthy as your situations allow. Please be well.
We encourage you to visit these previously shared Crisis Insights related posts:
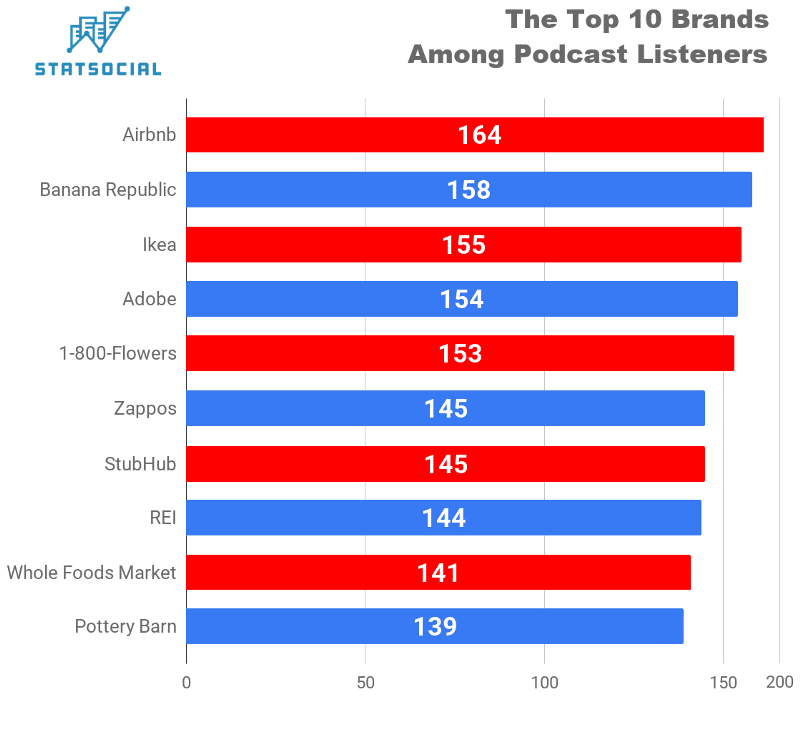
Proceeding in our mission to pair audiences with the ideal advertisers (and vice versa), for this entry we’ve employed the StatSocial Insights engine to calculate the 10 brands whose customer purchase data reveals the largest proportions of podcast enthusiasts among their consumer-bases.
This is some real tip-of-the-iceberg, top-line stuff here. Do you have a podcast for which you could use guidance in finding advertisers? Are you a marketer trying to sniff out which podcasts’ audiences will be most receptive to your brand? When queried, StatSocial provides mountains of detailed, actionable insights (about which we’ll elaborate a bit below) ultimately facilitating the most fruitful of partnerships.
For now, however, we’re going big.
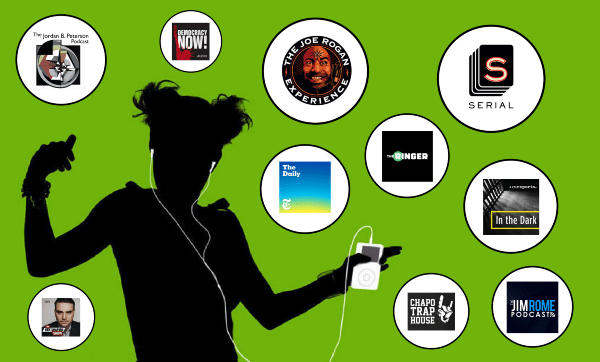
A retro pod and contemporary podcasts.
As a creative medium, it’s been clear for a while now that podcasting is here to stay. But over the past couple of years it has entered its financial boom time. The industry raked in around $400 million last year, and is predicted to reach $600 million in 2020. A drop in the bucket when compared to the billions being invested in radio and TV ads, but staggering growth when compared to the low stakes of only a few short years back in podcasting’s history.
As background, or a refresher: StatSocial pulls in and compiles all available data relating to any consumer audience about which you’d care to learn.
StatSocial’s affinity datasets are culled from the individual profiles of over 500 million social media users. Our analysis considers over 80,000 unique attributes. As a result, we provide an in-depth breakdown of an audience’s passions, media preferences, influencers, personality traits, and Digital Tribes.
Our reporting reveals things that could not feasibly be learned through hundreds or, truthfully, thousands of surveys and focus groups. StatSocial peers beyond the cultivated and curated identities of social media, and digs into what really makes the various segments of any given audience tick.
We do more than just provide numbers, though, we take what is learned through the statistics and translate that into strategy; such as social media campaigns, influencer partnerships, and, as is our focus here, sponsorship opportunities and brand partnerships.
Our reporting provides an understanding of a given base of customers that is unrivaled in terms of depth and nuance. StatSocial eliminates guesswork and assumptions from mapping out a marketing plan, or pursuing the most fruitful partnerships and avenues of exposure.
Of Specific Relevance to this Entry
Our taxonomies for all varieties of affinities are vast. For example — and of especial relevance here — there are over 3,000 podcasts cataloged and tracked in our taxonomy of the medium’s most prominent titles (in all genres, from politics to sports to knitting). Right out of the box, on the first query, and leaving no podcasting stone unturned, a brand and/or marketer can know with confidence which podcasts most resonate with both the audience they’re already reaching, as well as the as-yet untapped audience with which they hope to connect.
Regarding this matter from the opposite side, StatSocial provides podcast ad-sellers a clear view of their listeners’ varying affinities for every brand imaginable; the insights factoring in our massive taxonomies for virtually every conceivable variety of good and/or service available under the sun. The insights also reveal not only to what other podcasts the audience is listening, but the varying degrees to which they love each.
All of this is invaluable data when seeking to foster mutually beneficial and lasting partnerships, and to dedicate resources most effectively.
Let Us Begin
For this entry, we have used the findings of a well-known and respected retail marketing data platform (an industry standard, and a name we’ll happily provide, along with far more robust statistics, if you reach out to us privately).
The index score measures the degree to which our findings (in this case regarding the brand affinities of podcast listeners) either exceed, are in line with, or fall short of the findings of this unnamed platform’s data.
The portion of Aribnb’s customer-base who are also avid podcast listeners exceeds the baseline by 1.64 times. The portion of StubHub’s users who are also podcast fans exceeds the baseline by 1.45 times.
What the Above Tells Us
These summaries are based on our familiarity with the brands in question, and our general understanding of the relatively self-selecting population who are (currently most) drawn to podcasts. Ultimately, the insights available in a StatSocial report will answer nearly any question to which these top-line insights, or any other insights for that matter, might give birth. We peer beyond the superficial, and dig right into the heart and soul of what makes an audience tick.
Here, however, we’ll look at these statistics as presented. They surely tell us something on their own.
Airbnb
The top result makes perfect sense here. Right off the bat, an online-based business is a natural to find affinity with fans of an internet-born medium. Worth also noting, Airbnb is a platform for the traveler. What better opportunity does life provide for catching up with one’s favorite podcasts than long airplane rides?
While accommodations through Airbnb can be downright palatial, it’s generally considered an affordable alternative to traditional hotel accommodations. Still, jetting off to far flung locales is a bit rich for the blood of many.
We’ll return to this thought in a moment, as it seems to be an overarching theme here. This is no knock on podcasting, nor the brands most beloved by its fans. This is a highly desirable concentration of consumers, all within this one audience.
Our data reveals that users of Airbnb are chilling among this crowd to a degree that exceeds the baseline (again, as clarified above, the findings of a major retail marketing data platform) by over one-and-two-thirds times.
Banana Republic
Of the numerous retail chains owned by Gap, Inc., Banana Republic has in recent times been one of its best performing. After a pronounced slump, an updating of the brand’s mission — moving away from a creative-director-driven singular vision, and instead accommodating the demands of “fast fashion” — has turned things around.
While there are some popular fashion podcasts, the brand’s position on this list is likely attributable to audience overlap with podcasting as a whole. BR was, from its inception, conceived as a store for younger adults of higher incomes. Their customer-base, according to various sources, has pretty consistently hovered between ages 25 to 44, with well over half of their customers earning in excess of $75k annually.
Similarly, recent polling has said that about 45% of podcast listeners earn over $75k a year, with about 79% of the medium’s most dedicated fans falling between ages 18 and 54.
Finally, a theme that recurs throughout this list arises here. Like many once brick and mortar stalwarts, survival has meant finding a place in the e-retail sphere. Banana Republic has done a terrific job of establishing a presence online where podcast listeners, almost by definition, will be gathered.
Banana Republic customers, according to our data, can be found within this audience to a degreeexceeding the baseline by 1.58 times.
Ikea
There’s a certain American that comes to mind when picturing the average Ikea consumer. The biggest thing to come out of Sweden after ABBA, Volvo, Ingmar Bergman, and PewDiePie (pity that Army of Lovers never really broke in the states), the home furnishings behemoth brings to mind a collection of our country-persons with whom it is quite easy to imagine bonding over a shared love of ‘Radiolab.’
Or… Since Ikea’s minimalist design appeals to the pragmatic, as well as the ordered and tidy, you could be dealing with one who would hardly blanch when admonished to “clean up your room, bucko.” As such, perhaps instead of ‘Radiolab’ it might be the ‘Jordan B. Peterson Podcast’ that they pipe through their earbuds.
A quick glance at StatSocial‘s insights for Ikea’s audience actually suggests that discussing Rachel Maddow’s podcast, or the ‘NPR Politics Podcast,’ might prove most fruitful the next time you find yourself in conversation with a sworn Ikea devotee at a cocktail party. Our point, however, remains true. Not to stereotype, but the stats bear it out. The Venn diagram of Ikea consumers — largely upwardly mobile young adults — and podcast listeners does show significant overlap.
When contrasted with the retail purchase data set we’re using here for our overlay, StatSocial finds Ikea shoppers among the podcast loving throngs to a degree exceeding the baseline by 1.55 times.
Adobe
Acrobat, Photoshop, Flash, InDesign, Illustrator, and on and on. Adobe’s softwares have been as fundamental as any in shaping our contemporary world. They are also some of the most foundational tools of the trades of those working in marketing, advertising, design, and really any line of work where visual presentation and non-verbal communication are essential.
Podcasts appeal to young, upwardly mobile professionals more so than to any other single group, and those of such a description are increasingly working in creative fields. Why this brand would rate so highly with this audience is rather evident after even passing consideration.
If you are a designer, or working in a related field, then you already know there are few jobs that better lend themselves to indulging in an ostensibly audio-based medium, providing countless hours of content weekly. Coders, designers, proofreaders, writers, and others who have spent more than their share of hours immersed in Adobe’s products have often done so with a pair of headphones affixed to their ears. They may be listening to Tangerine Dream, but these days it’s just as possible that they’re cranking out ‘Your Mom’s House.’
Our insights find avid Adobe users are present among the podcast listening population to a degree exceeding the baseline by 1.54 times.
1-800-FLOWERS
Few businesses adjusted to the dawn of a brave new world so elegantly as did 1-800-FLOWERS. A pioneer in direct sales, the New York based, flowers-by-phone retailer was one of the first businesses to offer a 24–7, toll-free number, always open for business. Other companies followed suit (notably, 1–800-MATTRES: “Leave off the last ‘s’ for ‘savings’”). The phone number itself had changed hands a number of times before, in 1986, it finally wound up the property of those who would turn it into a literal pile of cash.
1-800-FLOWERS.com probably was greeted with a wince or two when first suggested as the company’s URL. Now, boldly owning this mixed communications media identity, the company’s official name is 1–800-Flowers.com, Inc.
They are an e-commerce business, which similar to the above entries, makes the reasons for their presence here immediately evident. More crucially, though, they’ve been a regular podcast sponsor since December of 2017. As of February of this year, they were one of the top 10 most prevalent sponsors across the entire medium.
1–800-FLOWERS customers are rubbing elbows with the others of the podcast fanatic set to an extent surpassing the baseline by 1.53 times.
Zappos
Ever more e-commerce graces our list.
We don’t know for certain, but deriving what we’d guess was inspiration from the Frank Zappos* song, “Brown Shoes Don’t Make It,” the British born, California raised entrepreneur, Nick Swinmurn, set about launching an online shoe store, originally called ShoeSite.com.
That name lacking pizzaz, in July of 1999 it was decided they should come up with something less limiting and more snappy. Swinmurn looked no further than the youngest Marx Brother, Zappos*, for his company’s name.
Okay, okay… The name is actually derived from zapatos, Spanish for “shoes.” That said, the site’s inventory has included a wide variety of goods — apparel, accessories, athletic wear, jewelry, etc. — since 2007. In July of 2009, 10 years after the company’s official founding as Zappos.com, they were acquired by Amazon for $1.5 billion (the company’s former CEO, Tony Hsieh, can be heard on a 2016 episode of the ‘We Study Billionaires’ podcast here).
If you were to dig into the StatSocial reports for ‘The Joe Rogan Experience’ you’d detect a pronounced contrast of interests, demographics, and personalities when compared to the audience of, say, ‘Serial.’ But when looking at podcast listeners as a whole, it’s only right and natural that internet oriented businesses are conspicuous. Long walks and runs make for terrific podcast time. Maybe that connection is a bit of a reach, but the fact remains that Zappos is the internet’s biggest shoe retailer. We’ve all got to wear shoes, and it adds up that those creatures sufficiently knee deep in the internet to be turning to it for entertainment would also use it in their quests for footwear.
StatSocial’s data finds this well-heeled group to be among podcasting’s greatest boosters to a degree that exceeds the baseline by 1.45 times.
(*These are very, very silly jokes.)
StubHub
While podcast listeners may seek their entertainment via non-traditional media, they must not be mistaken for shut-ins. If they were, they’d have no need for Zappos, after all. They have places to go and people to see.
The places they go, at times, include sports, concert, and theater venues, and the people could include Kendrick Lamar, the cast of ‘Beetlejuice the Musical,’ or the Philadelphia Eagles.
There was a time when, if an event was sold out, you’d have to show up at the venue a couple of hours beforehand and haggle with less-than-reputable businessmen to procure a ticket for a dollar amount well exceeding the face value.
While street scalpers, at least here in New York City, are a thing of the past, StubHub has made readily available to any and all willing to shell out the extra scratch, entrée into nearly any public event which you can imagine.
People attend events (be they concerts, sporting events, lectures, operas, what-have-you, but happenings of sorts to which numerous podcasts are dedicated) and it makes terrible sense that the crowd being grouped together here — meaning, those sourcing their entertainment and information (or, when combined, edutainment) from cyberspace — would also procure tickets to said events from same.
Our findings suggest that the StubHub faithful overlap with the podcast grateful to a degree exceeding the baseline by 1.45 times.
REI
Just because you felt duty-bound to take a selfie from the summit of Kilimanjaro, to post on Instagram, it doesn’t change the fact that you dragged your butt up there in the first place. Good luck connecting to 4G, however. Maybe 5G will fix that.
In the meantime, this audience of podcast Stans have revealed themselves as well-employed travelers, quick to give the gift of flowers, and appreciative of a sweet new pair of kicks to wear when they go see Ariana Grande. This brand’s inclusion on the list goes one better than merely saying these people leave the house. They REALLY leave the house.
Our young, upwardly mobile, podcast listening crew is, if nothing else, appropriately outfitted for some rugged, rough and tumble, outdoorsy activities
Given what we know of this audience, it adds up that it would contain a strong proportion of skiers, snowboarders, rock climbers, and the like.
Our calculations have revealed that REI’s customers are also podcast listeners to a degree that exceeds the baseline by 1.44 times.
Whole Foods Market
Again, we are genuinely trying to avoid stereotypes about who the podcast generation may be. There would be those, however, who might not be entirely surprised to find Whole Foods ranked highly among the brands for which podcast listeners show the strongest affinities.
The same intersection of age and income cited above applies here. It bears repeating that further digging into the metric ton of insights StatSocial has on offer will determine beyond doubt the degree to which this demographic overlap informs this affinity (along with a much more nuanced and detailed analysis).
StatSocial’s data shows that Whole Foods finds affinity among the podcast listening segment of the population to a degree 1.41 times greater than the baseline.
Pottery Barn
While we recognize that it’s a chain store iteration of the aesthetic, this is still pretty handily the most folksy entry on this list. Even while REI celebrates outdoorsiness, it does so in a rather cosmopolitan way.
Pottery Barn takes two inherently folksy words, joins them together, and winds up bringing to your cold, harsh day something akin to a kind hug. The merchandise they sell does the same.
While Ikea sells home furnishings, one pictures their items in the homes of young adults — kids just out of college, newlyweds just having their first kid, that sort of thing — which makes this the first brand on this list that truly smacks of a wholesome and genuine domesticity.
That would be until very recently, where a slight tweaking of the brand has occurred. During these days when fewer and fewer young people — even those with children — are opting to live in the suburbs (or in places even more remote), Pottery Barn has taken to stocking an inventory and cultivating an aesthetic better suited to smaller abodes. If they’re looking to maximize the space within New York dwellings, some manner of vase / bunk bed hybrid could be both practical and bring to the cold, unforgiving surrounds of we New Yorkers a much needed return to simpler times. Back to the times when we used to make, bake, and keep all of our pottery in a barn.
Inquire Within for Genuine Revelations
Looking at the top 10 podcasts the week this entry is being written, things hardly seem overly monolithic. There is diversity in content. In the grand scheme, though, things could surely be a bit less homogeneous.
You have Dr. Phil, Joe Rogan, teenage YouTuber Emma Chamberlain, a true crime podcast, a Rami Malek starring dramatic podcast, a couple of exposé type programs, and not one, but two ‘Game of Thrones’ podcasts.
People from a rich and varied array of economic and ethnic backgrounds have come to embrace the realization of digital media’s democratizing promise. While there does still seem to be a point of delineation where one is, say, no longer a “SoundCloud rapper” and is simply a mainstream rapper, many of these performers’ biggest fans hardly noticed when that line was crossed.
There are podcasts of all conceivable stripes, many of which are quite profitable, but whose audiences may seem under-represented in a broad-stroke list like this. StatSocial, we assure you, is capable of nothing if not granularity. It is not, however, some big whopping data dump. Everything is organized, comprehensible, and easily navigated, and the team of experts here is all too equipped to clarify and aid you in quickly putting to use all of the many insights provided.
As stated above, this is but a glimpse of the data we have on offer. StatSocial can, and does, get far more specific (Curious about the audience of a specific podcast, or a genre of podcast, or a podcasting network, etc.? We have answers on top of answers).
Take a Sniff Around
Insights on top of insights can be found by the curious reader who chooses to poke around the StatSocial blog here. Peruse the many entries, offering all kinds of insights, studies, and deep dives to better acquaint you with the capabilities of StatSocial.
Throughout the blog are many examples of the sorts of insights that can only be gained with StatSocial.
We return to this blog today to share more insights reported by StatSocial’s Crisis Insights service. This particular chart will be updated on a weekly basis, each Monday/Tuesday.
For those new to Crisis Insights: The subscription service has been built using StatSocial’s Silhouette™ social data platform. The service is a tool for brands, marketers, and agencies seeking to understand the rapidly changing dynamics of their customers who, as a result of the uncertainty born of the COVID-19 pandemic, are finding their customer dynamics shifting during these trying times.
The 50 United States, ranked by online engagement with Novel Coronavirus / COVID-19 topics, from most engaged to least
Explanation of the above data: The scores on the above chart are index scores. Used for convenience here, these scores summarize, at-a-glance, the degrees to which social media content related to novel coronavirus / COVID-19 topics have been engaged with by the residents of each state.
The index scores are calculated based on contrasting the above described statistics with the entire United States population’s engagement with novel coronavirus / COVID-19 topics. A level score of 100 is used to represent this national number, and the scores on the above graphic report the degrees to which each state’s engagement is in excess of or is equal to (represented in green), or falls short of (represented in red) that baseline.
Each state’s engagement has been broken out by week (the first three to have transpired since Crisis Insights’ launch). This allows you to see how engagement has increased, decreased, or held steady week-to-week.
The data used for Crisis Insights’ reporting is collected and analyzed daily, and then reported to subscribers as rolling seven and 30-day averages (as well as a full data series).
In addition to the insights shared here — regarding where each state’s residents stand when it comes to engagement with topics surrounding the COVID-19 matter — this also offers a small glimpse into how our constantly revised, amended, and well-presented reporting allows brands to observe, compare, and retain context for customer behaviors, concerns, affinities, etc., as they shift, change, and are even replaced over the coming weeks and months.
Massachusetts is the top ranked state here, with its citizens’ engagement with online COVID-19 coverage exceeding the baseline by 1.41 times. The state’s week of highest engagement, to date, has been the week of March 22 to March 28. The week of March 29 to April 4 has, thus far, seen the lowest engagement from the state’s residents.
As of this writing, the state has been home to the third highest number of diagnosed cases, and the fifth highest number of confirmed deaths from the virus.
At the other end of the spectrum is Mississippi, which has thus far seen the 28th highest number of diagnosed cases. It has experienced the 26th highest number of confirmed fatalities resulting from the virus.
The state’s week of lowest engagement, to date, has been the week of March 22 to March 28. The week of March 29 to April 4 has, thus far, seen the greatest engagement from the state’s residents.
Finally, for now, of very real note is the upward trend in engagement detectable among many states currently found in lower half (mid-30s to high-40s). Kansas, Iowa, Wisconsin, Kentucky, the Dakotas, Utah, West Virginia, and Arkansas have all found their residents engaging with COVID-19 content to an increasing extent.
We eagerly invite you to visit our Crisis Insights page here, and to reach out to us to learn a great deal more about the service, and to check out a demo.
As before, and as always, we sincerely hope that all reading are doing as well as circumstances allow, and are safe.
What are Crisis Insights?
Crisis Insights provides subscribers with near real-time updates on how the unprecedented climate in which we all find ourselves is affecting consumer sentiment, both among the general public, as well as a brand’s specific customers.
Changes in consumer sentiment are tracked in this reporting, for 32 crisis-related segments, across four general categories:
People concerned about the Covid-19 epidemic
People concerned about the direction of the economy
People coping and adjusting to the ‘new normal’ environment
General attitudes and psychographic outlook of the population.
We encourage you to visit these previously shared Crisis Insights related posts:
We took a look at the personalities of those most actively engaged with COVID-19 content online:
We use cookies on our website to give you the most relevant experience by remembering your preferences and repeat visits. By clicking “Accept All”, you consent to the use of ALL the cookies. However, you may visit "Cookie Settings" to provide a controlled consent.
This website uses cookies to improve your experience while you navigate through the website. Out of these, the cookies that are categorized as necessary are stored on your browser as they are essential for the working of basic functionalities of the website. We also use third-party cookies that help us analyze and understand how you use this website. These cookies will be stored in your browser only with your consent. You also have the option to opt-out of these cookies. But opting out of some of these cookies may affect your browsing experience.
Necessary cookies are absolutely essential for the website to function properly. These cookies ensure basic functionalities and security features of the website, anonymously.
Cookie
Duration
Description
cookielawinfo-checkbox-analytics
11 months
This cookie is set by GDPR Cookie Consent plugin. The cookie is used to store the user consent for the cookies in the category "Analytics".
cookielawinfo-checkbox-functional
11 months
The cookie is set by GDPR cookie consent to record the user consent for the cookies in the category "Functional".
cookielawinfo-checkbox-necessary
11 months
This cookie is set by GDPR Cookie Consent plugin. The cookies is used to store the user consent for the cookies in the category "Necessary".
cookielawinfo-checkbox-others
11 months
This cookie is set by GDPR Cookie Consent plugin. The cookie is used to store the user consent for the cookies in the category "Other.
cookielawinfo-checkbox-performance
11 months
This cookie is set by GDPR Cookie Consent plugin. The cookie is used to store the user consent for the cookies in the category "Performance".
viewed_cookie_policy
11 months
The cookie is set by the GDPR Cookie Consent plugin and is used to store whether or not user has consented to the use of cookies. It does not store any personal data.
Functional cookies help to perform certain functionalities like sharing the content of the website on social media platforms, collect feedbacks, and other third-party features.
Performance cookies are used to understand and analyze the key performance indexes of the website which helps in delivering a better user experience for the visitors.
Analytical cookies are used to understand how visitors interact with the website. These cookies help provide information on metrics the number of visitors, bounce rate, traffic source, etc.
Advertisement cookies are used to provide visitors with relevant ads and marketing campaigns. These cookies track visitors across websites and collect information to provide customized ads.