This is a deep dive comparison of the respective user bases of Slack and Microsoft Teams, made possible with insights unique to StatSocial. Please enjoy our take on “The Collaboration Wars!” and feel free to contact us if you have any questions.
By analyzing the most dedicated users of these competing platforms, across more than 80,000 dimensions (demographics, brand and media affinities, top influencers, personality traits, and more), we’ve ascertained each service’s customers’ priorities, passions, and tribes.
About this project
Time to gather the data & insights below: <10 minutes
Time to analyze data: ~1 hour
Time to write this analysis start to finish: <2 days
Microsoft Teams launched at the end of 2016 and in terms of raw numbers has overtaken Slack as the market leader. But key differences between the user bases are emerging and these distinctions are important for marketers and strategists to understand as the industry continues to develop.
First —a quick primer on the competing platforms (feel free to skip ahead if you are well-versed in both).
SLACK
Not long after Slack’s 2013 launch, many enterprises — billion dollar corporations and scrappy startups alike — regarded the platform as something almost heaven sent. Suddenly businesses of radically diverse needs, but with disparate, yet frequently collaborating departments, spread out within huge workspaces, or across the globe, could connect as though their desks were right next to each other. Businesses with a substantial portion of their staffs working remotely were suddenly provided an office, of a sort, to which everyone could could go each day, simply by opening a desktop app.
Any and all teams could stay on the same page, and share documents, assets, and the like, with an ease, speed, and clarity that, for a great many, surpassed all previous communication solutions; phone, fax, email, messenger, chat programs, carrier pigeon, all seemed archaic and inefficient by comparison.
During Slack’s first handful of years on the market, the cloud-based, all-in-one, team communication tool was lovingly adopted by a number of companies. Overnight it was integrated into day-to-day operations, and became an indispensable business tool, increasing communication and productivity in nearly all areas. It provided instant solutions to problems big and small, and cured ills with which many enterprises didn’t even know they were afflicted.
As of 2019, Slack has reported that they have over 10 million daily active users, which is some notable growth from the 4 million using the platform in 2016. About 88,000 teams opt to pay for one of Slack’s premium plans.
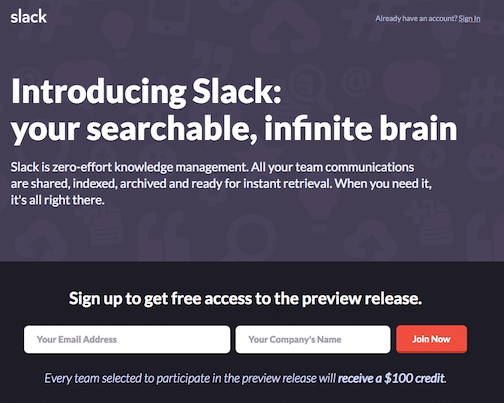
Slack’s landing page, circa-2013.
In its early days, six years ago, Slack’s website described the many useful tools comprising their platform as a “searchable infinite brain.” With Slack, all team communications — be they one-on-one, or company wide, and with all attachments and links intact— are indexed, archived, and effortlessly retrieved.
At first glance one could mistake it for gussied up chat software, but Slack is a great deal more sophisticated than that.
A vast array of apps are available, to allow enterprises to tailor their Slack experience to suit specific business and communication needs. They’ve also integrated a number of third party apps and softwares. Rather notable and useful is the way their services play exceptionally nice with Google’s numerous tools, many of which have become crucial to businesses big and small.
Slack and their “email killer” team workflow tools were revolutionary for many businesses, facilitating instant communication and in turn increasing collaboration, morale, invention, and efficiency.
MICROSOFT TEAMS
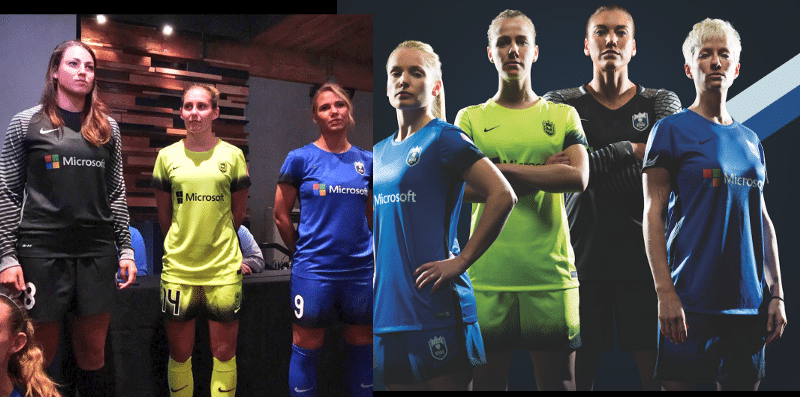
The National Women’s Soccer League’s Seattle Reign display their status as a Microsoft Team, of a sort. The tech behemoth has partnered with the team to have their name displayed, as you see here, on the players’ kits.
While Slack didn’t dominate the market (that they themselves had essentially invented) without any competition, for a long while they did so without meaningful challenge. That is until November of 2016.
A widespread rumor suggests that at the start of 2016, Bill Gates and Satya Nadella — respectively the founder and CEO of Microsoft (which is likely known to all) — considered putting in an $8 billion bid to acquire Slack. As the story goes, they ultimately decided to instead develop Microsoft’s own group chat app. That autumn, Microsoft Teams was announced.
As things have shaken out, as of this writing, Microsoft Teams is the market leader in terms of raw numbers; currently boasting 13 million users daily. Teams comes bundled with Microsoft Office 365 ProPlus, and some parties have suggested their numbers do not reflect reality entirely.
Butterfield, seemingly unfazed by the ascent of Teams, recently compared Microsoft’s hard push of the product to the billions of dollars they spent on the Bing search engine. He also cited Google’s ultimately failed attempts to salvage the now defunct Google+ by integrating it with all of their other services.
Both Slack and Teams are well-regarded by users. They provide different experiences, and appeal to different sorts of enterprises and groups. Slack has a warmer and quirkier feel, and the experience is more customizable. It feels like the virtual workplace experience that it aspires to provide.
Teams, on the other hand, integrates seamlessly with not only Microsoft’s warhorse Office suite — with such workplace essentials as Word, Excel, etc — but also the Microsoft owned Skype. The platform, thus far, apparently, doesn’t play as well with third party apps, but — taking for granted that such shortcomings will be addressed —to say that Microsoft’s products are nearly exclusively the softwares driving a majority of workplaces is not really hyperbole.
Our research reveals the audiences for each platform to be similar, but not the same. Let’s get into it.
Enter StatSocial — a Quick Primer on the Data Below
StatSocial’s data is sourced from earned engagement (e.g. what people read, like, follow, share, talk about, etc.) of over 300 million consumers. Our analysis of all the content people engage with creates over 80,000 unique attributes per consumer. As a result, we provide an in-depth breakdown of an audience’s interests, affinities, media preferences, hobbies, allegiances, to which of our Digital Tribes they belong, and thanks to our partnership with IBM Watson™ and the integration of their Personality Insights™ service into our analysis, even personality types.
Our reporting reveals things that could not feasibly be learned through hundreds or, truthfully, hundreds of thousands of surveys and focus groups. StatSocial peers beyond the manicured and curated identities of social media, and digs into what really makes the various segments of any given audience tick.
While what you’ll find below may seem like a lot of data, it is only the tip of the iceberg of the insights StatSocial has on offer, regarding these (and all other) audiences. That said, we’re experts at tailoring the analysis to our users’ needs, so the data is never overwhelming.
An Explanation of the Insights Below:
The insights below are mostly sorted according to our index score. The score shows the degree to which the corresponding demographics, behaviors, and/or affinities being reported either exceed, are in line with, or fall short of the baseline. For this study, the baseline we’re using is the average American across the web.
— — — — — — — — — — — — — — — — — — — — —
DEMOGRAPHICS
We should always begin with the most fundamental of insights, which is what we’re doing here.
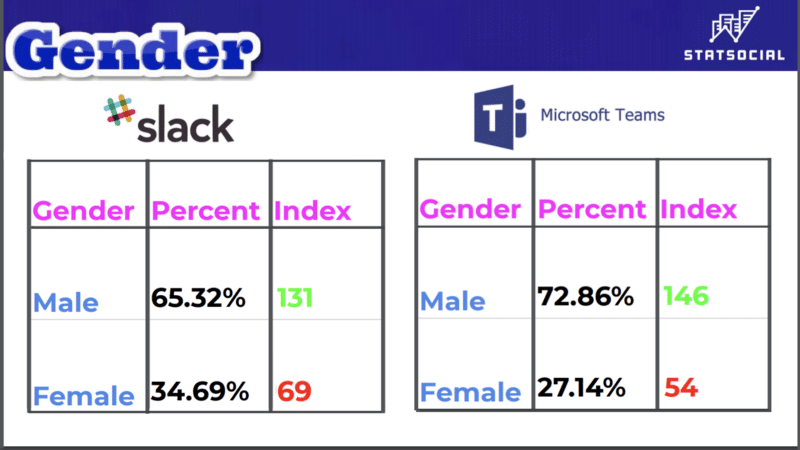
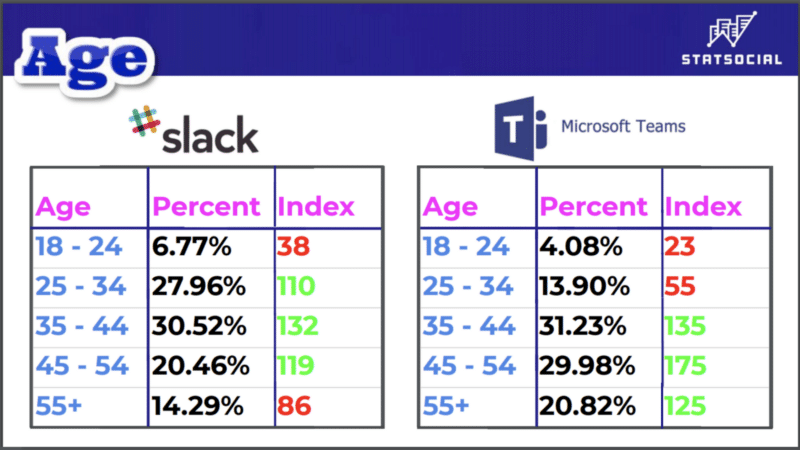
EXPLANATION: The index score reflects the degree to which the corresponding percentage is in excess of, is in line with, or falls short of our baseline (here, the average American social media audience). So, 65.32% of Slack’s audience is male. This exceeds the baseline by 1.31 times.
Comfortably over one-third of the Slack core audience is female. While that does fall well short of the baseline, that greatly exceeds the female portion of the Microsoft Teams customers here.
In keeping with what is explained in the caption to the previous graphic, 29.98% of Microsoft Teams’ customers are between ages 45 and 54. This percentage over-indexes our baseline by 1.75 times.
Appealing, as they do (and are), to startups and smaller companies, it’s not entirely shocking that Slack has the younger audience here.
Also worth noting, the portion of the Microsoft Teams audience that is 55-years or older exceeds the baseline by one-and-a-quarter times.
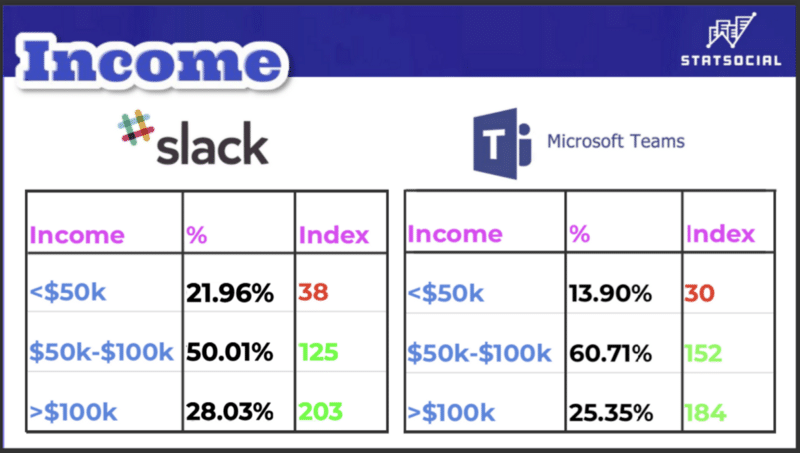
We could already take for granted that very nearly all customers being analyzed here are working. It seems, however, that they are also well-employed. The portions of both audiences earning over $100k a year exceed the earnings of the average U.S. social media audience by 2.03 and 1.84 times respectively.
— — — — — — — — — — — — — — — — — — — — —
LOCATIONS
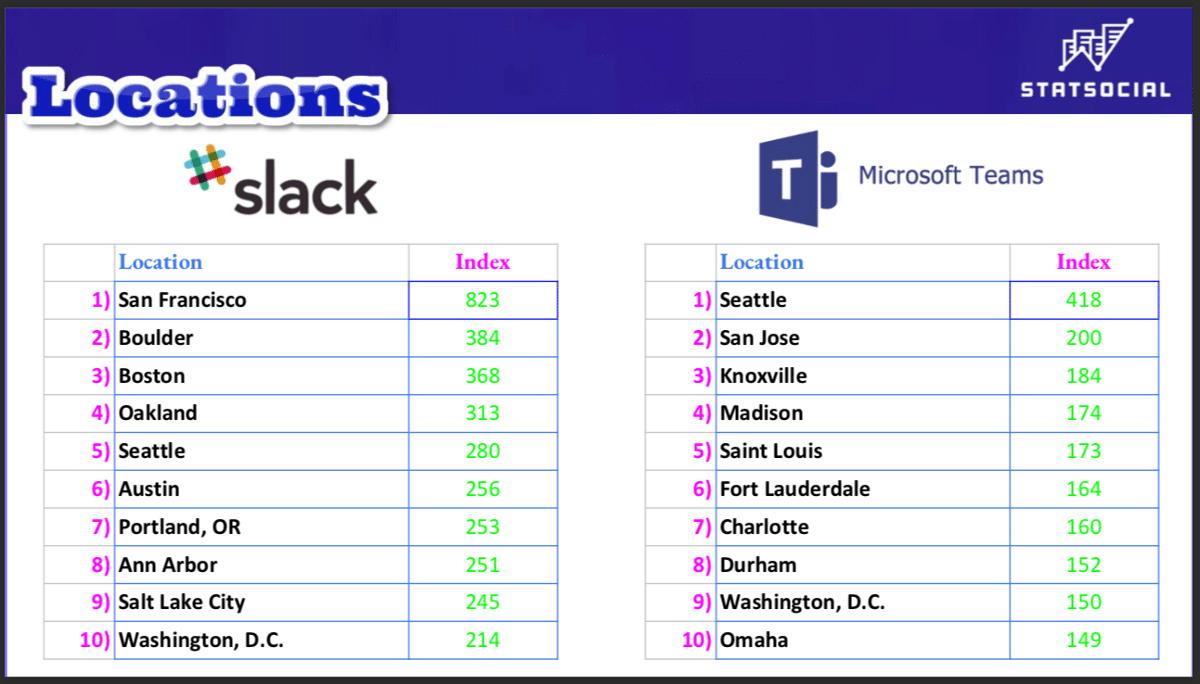
The percentage of Slack customers who reside in Boulder exceeds the quantity found among the average American social media audience by 3.84 times. The portion of Microsoft Teams customers who reside in Charlotte over-indexes the baseline by 1.60 times.
The headquarter city of each platform tops their respective lists, but after that things get a lot more interesting. Knoxville, Ann Arbor, Madison, Omaha, Austin; both platforms find favor in cities with vibrant startup cultures.
The degrees to which Slack’s consumers are over-indexed within their cities of residence is notably more dramatic than the same metrics for Microsoft Team’s audience.
— — — — — — — — — — — — — — — — — — — — —
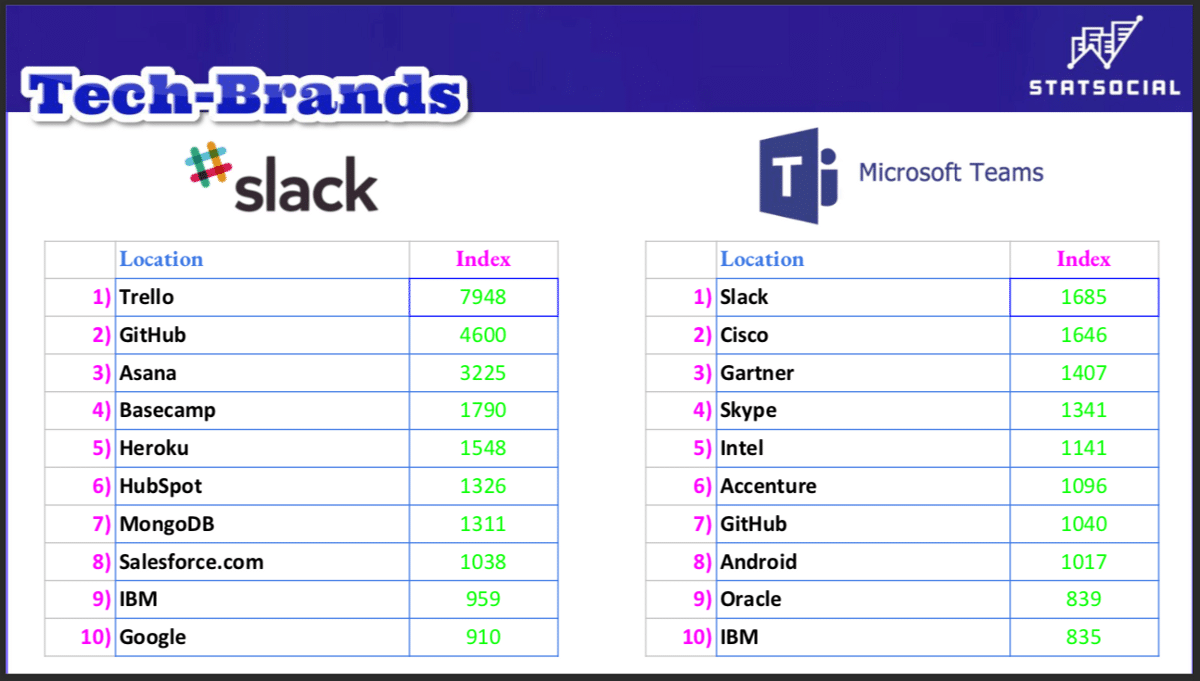
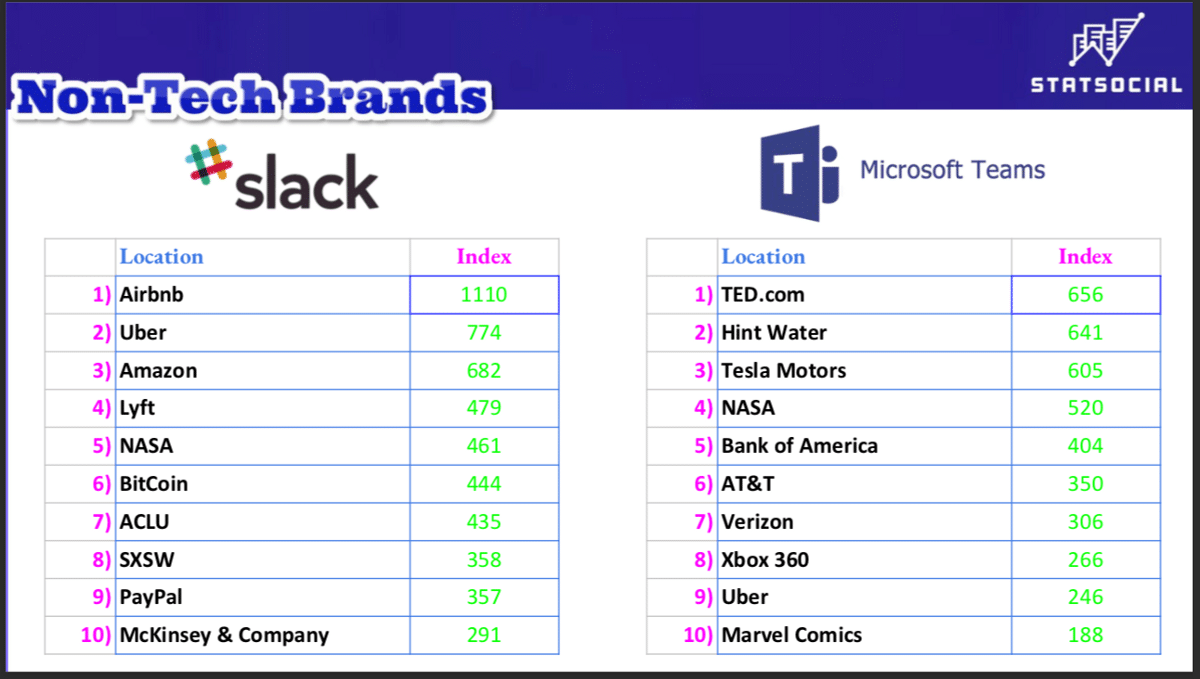
BRANDS
Because so many of the top brands, with each group of customers, are explicitly tech related, we have broken out the lists by both tech and non-tech brands.
It is surely worth noting, in this context, that the top brand among Microsoft Teams’ most dedicated customers is Slack. Indeed, the portion of their customers who are fond of Slackexceeds our baseline by 16.85 times. What that tells us is that there are a lot more Teams users who also use Slack than vice versa.
Internet companies, and other brands reflecting a fondness for technology — such as Tesla Motors — can be found here on both sides. Curiously, the Microsoft Teams side includes more leisurely concerns such as (the Microsoft-owned) Xbox and Marvel Comics.
Austin, Texas’ annual South By Southwest festival finds favor with the Slack crowd to a degree exceeding the baseline by 3.58 times.
— — — — — — — — — — — — — — — — — — — — —
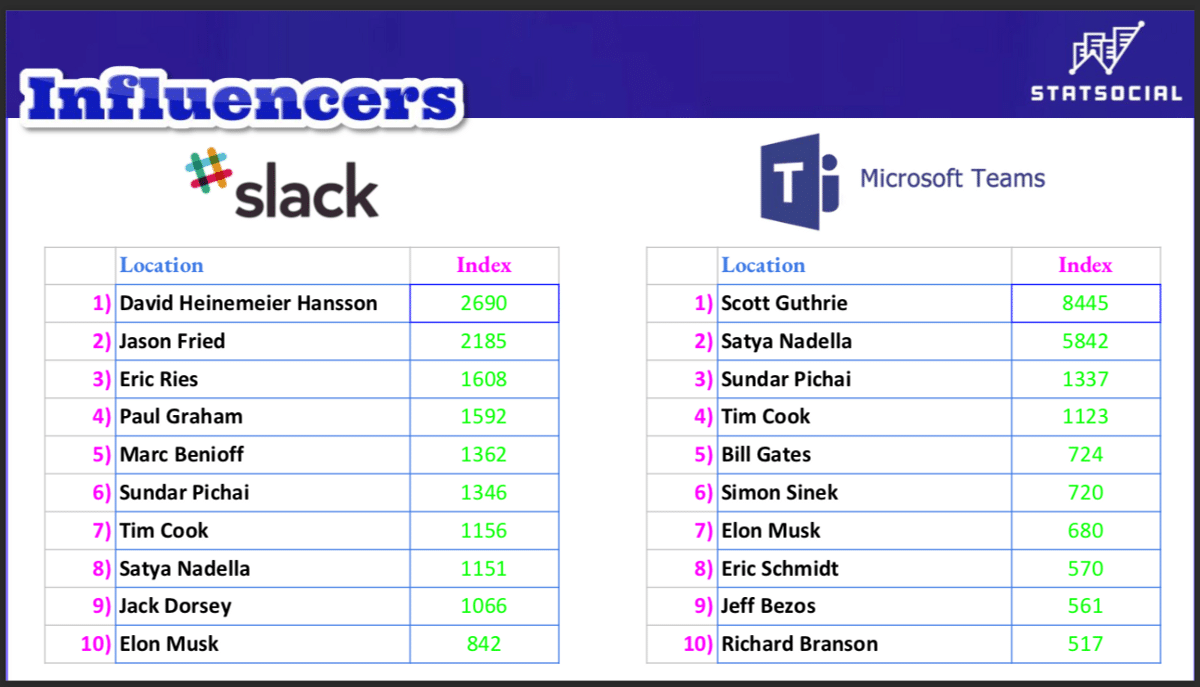
INFLUENCERS
Shockingly, given what we’ve learned thus far, there is neither a Jeffree Star nor a Kylie Jenner to be found below.
Instead, tech gurus, billionaires, and entrepreneurs seem to hold the biggest sway with the most loyal customers of each brand.
— — — — — — — — — — — — — — — — — — — — —
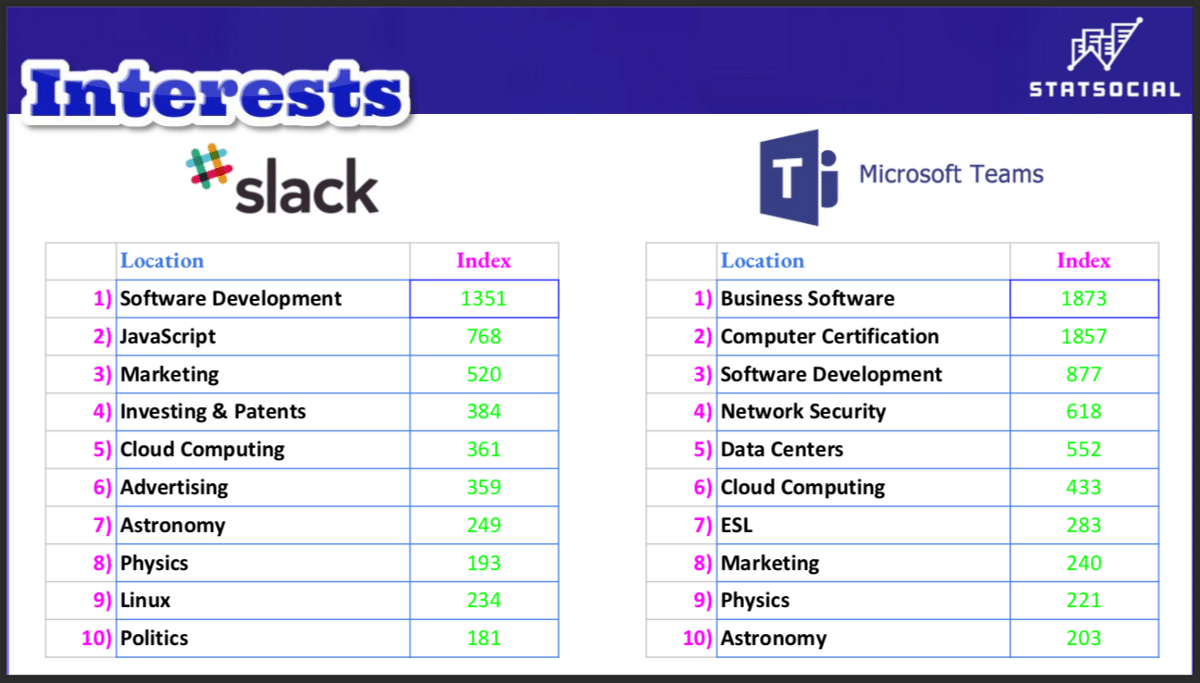
INTERESTS
These are more broad, top-level, general interests. But they do nothing to dispel the narrative thus far suggested within this entry.
Each customer-base deviates from its primarily techie/scientific interests with one entry each.
For Slack, politics stands out, the portion of their customers displaying interest in that area exceeds the baseline by 1.81 times. Microsoft Teams’ users contain a portion with a demonstrated interest in English as a Second Language that exceeds the baseline by 2.83 times.
— — — — — — — — — — — — — — — — — — — — —
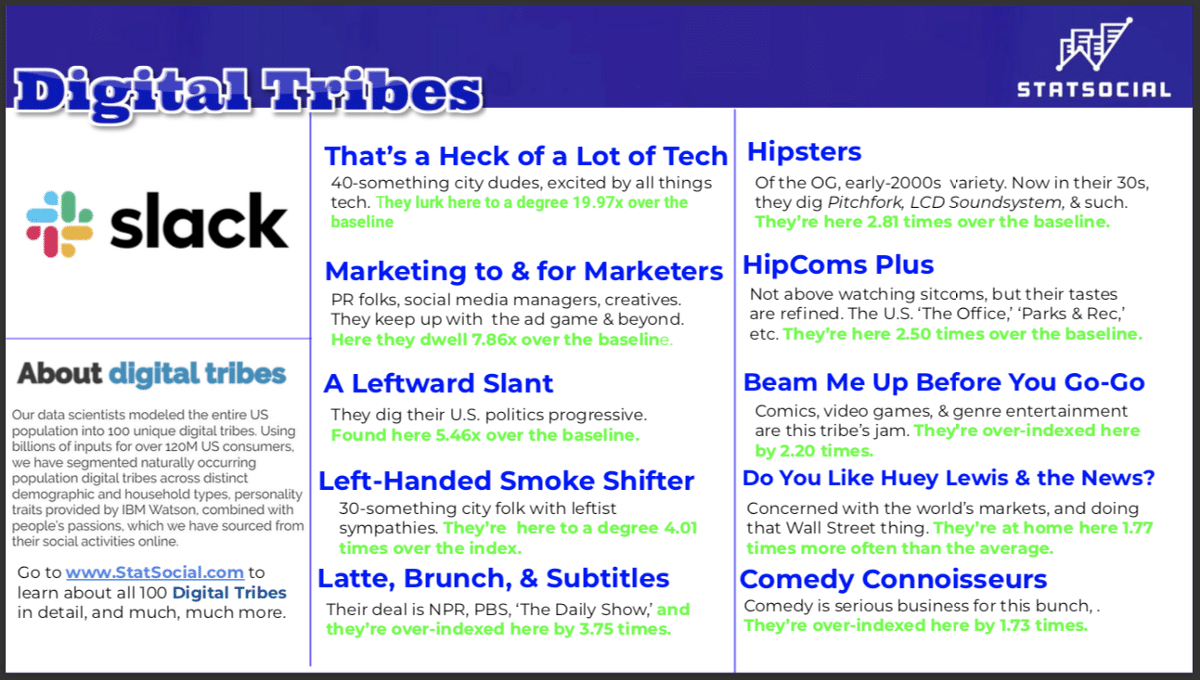
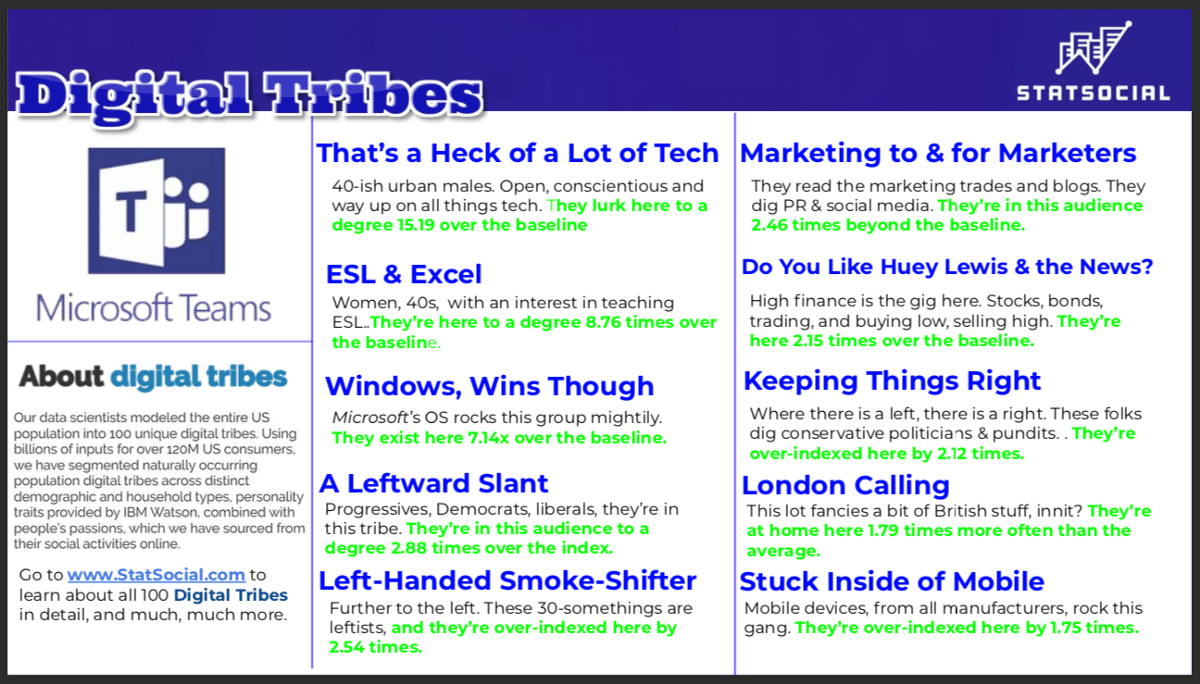
DIGITAL TRIBES
You can read a blog entry detailing this very special set of data by clicking this link, but we’ll also summarize things here.
StatSocial Digital Tribes is a model of the U.S. population broken down into 100 distinct market segments. Seeing which Tribes are present, and in what proportions, grants our users quick, crucial, and unprecedented insight into the humans who make up a given audience.
Combining our demographic and affinity data, with our Personality Insights® (powered by IBM Watson), we have been able to gather these utterly singular segmentation models. Both sides of the data coin are factored in — the demographic and the psychographic — enabling StatSocial to provide brands, publishers, media buyers, and agencies a comprehensive, in-depth understanding of their target audiences.
The graphics below show the 10 best represented Tribes among each of the audiences being explored. An ever-so-brief summary of the shared affinities, demographics, and/or personalities of each tribe is then provided.
More in-depth descriptions of each Tribe referenced below, and the remainder of our 100 Digital Tribes can be seen by clicking here.
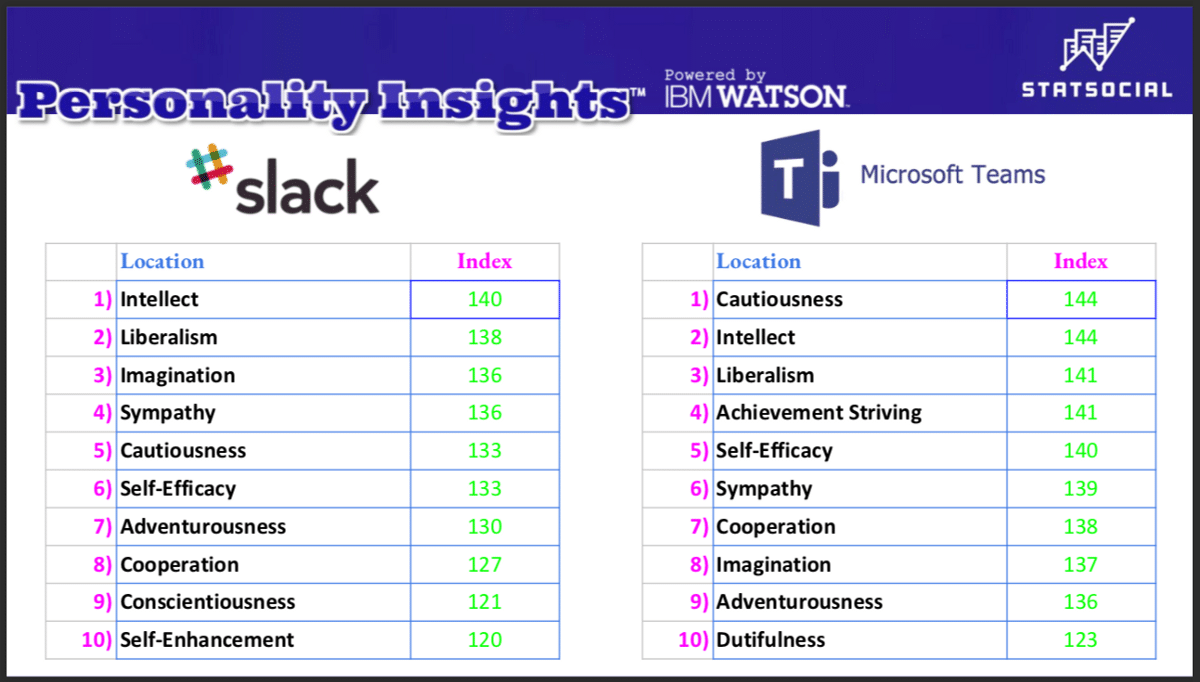
Among the great many things StatSocial will tell you about any audience, one of the most distinctive, revealing, and essential, is a breakdown of the various personality types to be found among the group that is under our microscope.
Thanks to StatSocial’s proud partnership with IBM Watson™ and the integration of their Personality Insights™ service into our reporting we can report on 52 unique personality traits with as much confidence as we do those metrics which to some might seem more concrete.
This only scratches the surface of the data available for each of these audiences, but it does seem consistent with the thesis presented at this entry’s opening
Each platform seems best suited to a certain type of enterprise. With Microsoft you get something more slick, with a fully integrated battery of apps used constantly in far more American workplaces than not. It serves its purpose directly and well. With Slack — for as big as the company has gotten — you get a product that allows for more personalization, and an experience that can incorporate the peculiarities and personalities of your team.
The audiences of each service are similar, but different in ways consistent with this perception.
There’s a great deal more to be learned here, though (or perhaps you’d prefer to learn something directly related to another industry, or an entirely different company, product, or platform). Reach out to StatSocial and we’ll gladly talk to you about it.
— — — — — — — — — — — — — — — — — — — — —
Take a Sniff Around
Insights on top of insights can be found by the curious reader who chooses to poke around the StatSocial blog here. Peruse the many entries, offering all kinds of insights, studies, and deep dives to better acquaint you with the capabilities of StatSocial.
Throughout the blog are many examples of the sorts of insights that can only be gained with StatSocial.
We are still basking in the afterglow of Super Bowl LIII, and the accompanying hubbub. Our Super Bowl fevers broken, and our bodies and brains fully restored to our 98.6 °F status quo, we can now ably analyze all that unfolded last Sunday with steely eyes and impartial hearts.
We here have returned to the passion that is dealing with cold, hard statistics. Thanks to the powerful abilities of the StatSocial audience analysis tool, we have insights galore surrounding much of what transpired before the eyes of the world this past weekend.
Join us now for our first entry sharing just a hint of what we’ve learned about all of it.
Winter Arrived, As Promised. So Now What?
Of the Super Bowl Sunday happenings that have folks abuzz this week, few surpass the sight of HBO’s beloved ‘Game of Thrones’ crashing in, and wreaking havoc, on Bud Light’s highly quoted and viral “Dilly Dilly” ad campaign.
An integrated campaign of this nature provides for us a perfect opportunity to highlight the unique power of StatSocial, even if we’re only revealing the tip of our vast mountain of insights.
In August of 2017, a Bud Light spot entitled “Banquet” was unveiled to the world.
Conceived by the ad agency Wieden+Kennedy, the campaign’s medieval setting, and timing of the first commercial’s debut, were chosen deliberately to complement and coincide with the finale of ‘Game of Thrones’’ seventh season.
The campaign really caught on with the public, with its “Dilly Dilly!” catchphrase inspiring a million memes, and finding itself incorporated into countless wedding speeches.
For the Super Bowl LIII “Joust” spot HBO, and their agency Droga5, were brought in as necessary collaborators.
Now, to Some StatSocial Business
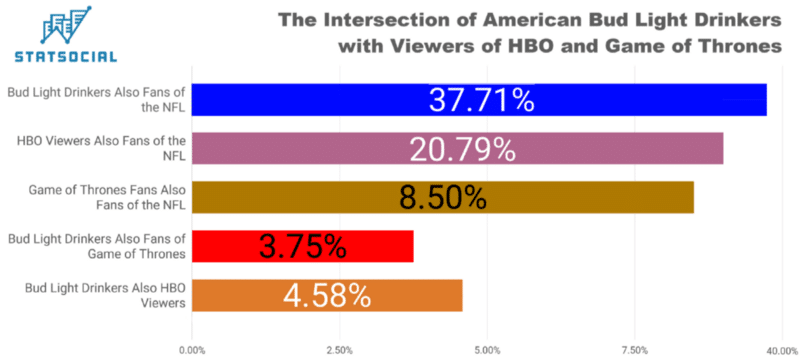
The below graphic provides top line statistics, revealing the audience segments with whom the #ForTheThrone / “Joust” spot would certainly have resonated most strongly.
We set about calculating the reported affinities by analyzing hundreds and hundreds of thousands of American ‘Game of Thrones’ fans, Bud Light drinkers, and HBO viewers.
37.71% of Bud Light Drinkers are NFL fans. 20.79% of HBO Viewers are NFL fans. 3.75% of Bud Light Drinkers are Game of Thrones fans. 4.58% of Bud Light Drinkers are HBO viewers.
For basic context, we first established what percentage of each audience is made up of NFL fans. From there we discovered that very nearly 38% of Bud Light’s drinkers are fans of the NFL. As we discussed in an entry posted last week, the brand is the league’s official beer sponsor, and will be for some years to come. As such, we imagine this statistic alone would be pleasing to both league and brand.
Over one-fifth of HBO’s audience are fans of the NFL. This seems beyond reasonable when you consider that the network and the league have been working together, on one program or another, for over 30 years.
Digging down a layer into, specifically, the ‘Game of Thrones’ faithful, a not insignificant 8.5% are NFL fans.
That established, we then set out to determine to what degrees Bud Light’s drinkers were viewers of the program and the network.
A very reasonable proportion of Bud Light’s sizable audience — 4.58% to be exact — are fond of the HBO service. Suggesting that ‘Thrones’ is something of a jewel in the pay TV giant’s crown (if you’ll forgive our metaphors), 3.75% of Bud Light’s greatest enthusiasts are also fans of ‘Thrones.’
As said above, these are only the tiniest hints at the insights we have to offer. Before drawing any definitive conclusions some deeper digging would be advisable. Based on this rather telling data, however, it seems that the vast majority of Bud Light’s HBO subscribing fans may not be in it solely for the ‘Thrones,’ but they do love those ‘Thrones’ all the same.
Summary of the “Joust” Commercial
If you’ve not yet seen the clip, or have not yet heard tell, in brief, it goes like this:
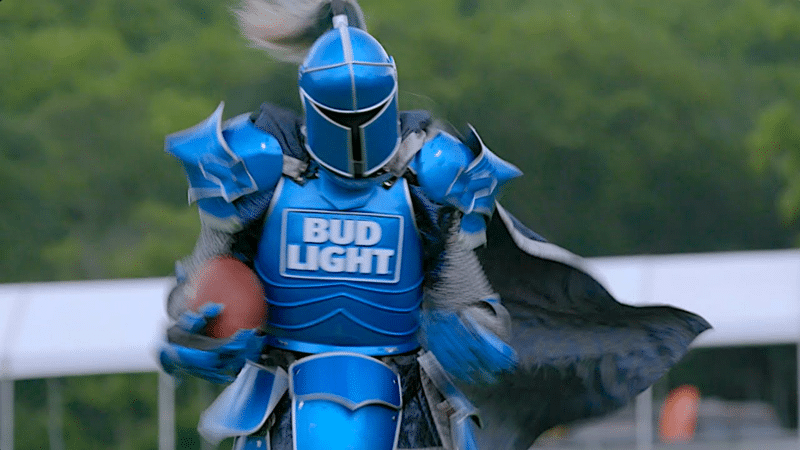
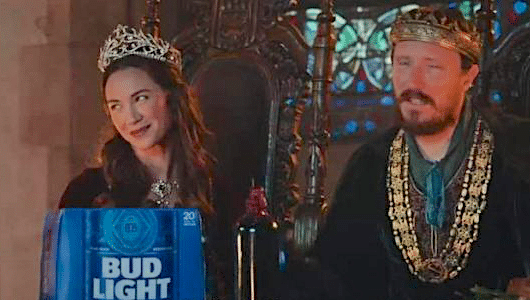
The Bud Knight — a fixture of the “Dilly Dilly”-verse — is shown about to start a jousting match. All is in keeping with the silly and comical tone viewers would expect from these ads. Suddenly, though, things turn ominous. As the joust begins and the horses charge, the Bud Knight is knocked off of his steed and killed. We suddenly see that the opposing knight is none other than ‘Game of Thrones’ character, The Mountain (played here by ‘GoT’’s own Hafþór Júlíus Björnsson). Suddenly, ‘Thrones’’ familiar theme music begins to play as we see a massive, menacing dragon fly overhead. As the spot nears its ending, we see the beast setting ablaze all within Bud Light’s medieval continuity. Words then appear on screen announcing, “Game of Thrones — The Final Season,” then we are greeted by the hashtag “#ForTheThrone,” and finally “HBO — April 14.”
It’s a brilliant commercial. It subverts expected tropes with the utterly unforeseeable demise of a central character — which is pulled right from George R.R. Martin’s storytelling rulebook — and the result is a beautifully executed piece of cobranding. The cultural touchstone that the commercials had initially set out to parody quite literally comes galloping in to lay waste to the whole campaign. By commercial’s end, ‘Game of Thrones’ emerges victorious and wins the coveted and highly valued Super Bowl airtime.
Take a Sniff Around
We did a bunch of football related entries the past couple of weeks, and we invite you head over to the greater StatSocial blog here to check them out. While there, you can also peruse the tons of other entries, offering all kinds of insights, studies, and deep dives to better acquaint you with the capabilities of StatSocial.
Throughout the blog are many examples of the sorts of insights that can only be gained with StatSocial.
The week following Super Bowl LIII is drawing to a close, but there’s still much to discuss. Those who’ve been visiting the StatSocialblog over the past few weeks have been enjoying the many insights shared here about every NFL team’s biggest fans.
The StatSocial tool provides a massive variety of accurate, unique, and actionable insights regarding any audience you can imagine. The advertisements aired during Super Bowl LIII’s telecast featured some inspired cobranding.
The StatSocial platform guides brands, companies, and marketers to wise and fully informed choices. StatSocial is an especially powerful advisor to those seeking mutually beneficial integrated marketing opportunities, including (perhaps especially) those that may not seem so obvious on their faces.
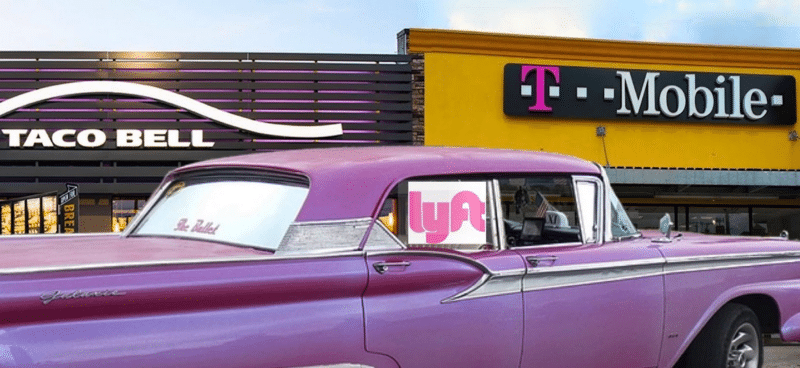
Internationally known communications brand, T-Mobile, featured not one, but two, collaborators in their Super Bowl LIII customer appreciation promotion. Multiple spots that aired during the game announced that T-Mobile’s customers had some free stuff coming to them. Why? Well, to quote the company directly, “just because.”
The Partnerships
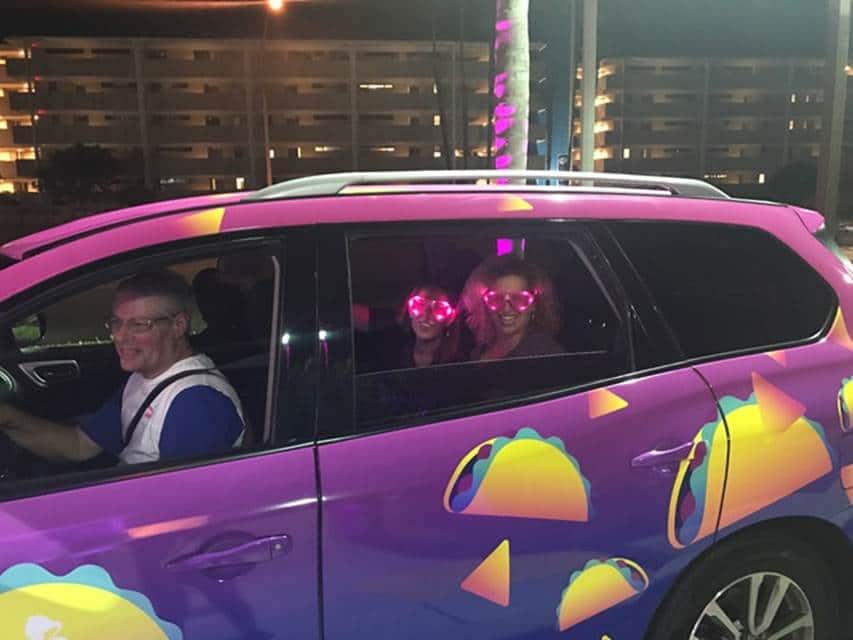
One enticement promised through this campaign is a free ride via on-demand car service, Lyft.
The other treat is free tacos, every Tuesday. These foodstuffs come courtesy of Taco Bell.
All in all, these perks are nothing to sneeze at.
The details can be found via posts on T-Mobile’s website, here and here.
Regarding the Taco Bell partnership, they shared this:
“T-Mobile and Taco Bell felt like natural brand friends, and we were just waiting for the perfect opportunity to make a partnership come to life, in a way that befits what our fans expect from us both. No question this collaboration in the Super Bowl was that perfect opportunity,” said Marisa Thalberg, Global Chief Brand Officer, Taco Bell Corp. “We cannot wait to give T-Mobile Tuesday customers and Taco Bell fans the chance to access a little ‘Taco Bell’ magic, any day of the week.”
T-Mobile’s CEO, John Legere, added these spunky words regarding the Lyft collaboration:
“While Verizon and AT&T have been taking their customers for a ride for years, we’re all about giving ours a ride on us. The best customers in wireless deserve a Lyft. It’s a massive ‘Thank You’ just for being with us. For free. For real.”
“So StatSocial You Say?”
We are not here to editorialize. This is also not Monday morning quarterbacking (or whatever day of the week it is you’re reading this), as these are statistics.
This is what the numbers were going into Sunday’s game. We’re providing them as a tiny sampling of what can be learned from StatSocial.
As is being concluded with increasing frequency, social media audience analysis is far more reliable than traditional research for learning public opinion(s), and predicting public behaviors. When such analysis has been calculated by matching social media data with the vast wealth of more granular, distinctive, and nuanced audience insights available throughout cyberspace — as StatSocial does with an accuracy unmatched by any other platform — there are no numbers of surveys or focus groups that can possibly tell you so much.
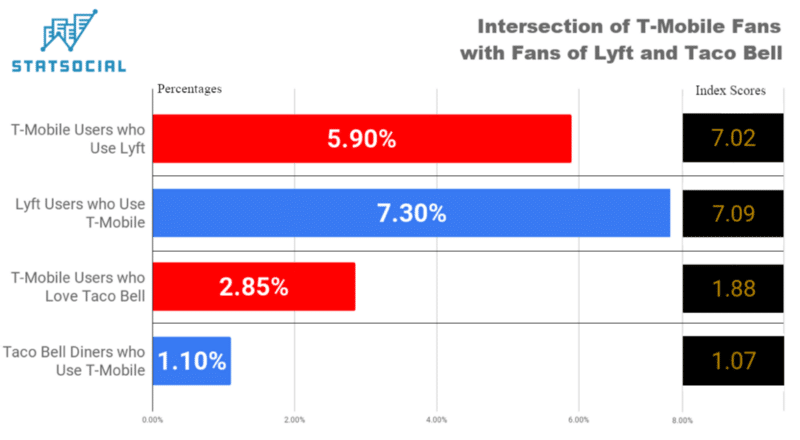
The below graphic shows what percentage of T-Mobile users also eat Taco Bell and/or also use Lyft. The “index score” on the far right represents the degree to which these numbers exceed, fall short of, or are in keeping with the baseline. For this, we’ve used the average American social media audience for that context.
5.9% of T-Mobile users also use Lyft, which exceeds the U.S. average by a little over 7 times. 7.3% of Lyft users use T-Mobile. which exceeds the U.S. average by nearly 7 1/10 times.
Lyft
The above shows us that there is already a quite healthy cross-section of users between T-Mobile and Lyft. The proportion of T-Mobile users who employ Lyft’s services exceed the number of Lyft users found among the average U.S. social media audience by a hair over seven times. The number of Lyft users who use T-Mobile exceed the average by even a touch more, approaching seven-and-one-tenth times.
As this is ostensibly a customer appreciation promotion, right off the bat there is a real suggestion of that mission realistically being accomplished. This is something a not insignificant portion of the immediately targeted audience would want. As probably goes without noting— while significant statistically — 5.9% and 7.3% each still leave plenty of room for growth.
There are so many additional insights that StatSocial’s reporting provides that would be considered before taking action, but based on these insights, for this quick taste here, it appears that this partnership would likely be a positive one for both parties.
Taco Bell
The intersection of T-Mobile users and Taco Bell diners is not as profound as what’s shown above. This suggests strong potential gains for both partners, particularly as this aspect of the campaign is more robust than than the Lyft promotion. Here, T-Mobile users are being offered a strong incentive to enter Taco Bell restaurants every Tuesday for free food.
Free grub alone has an irresistible pull, and its provision is likely to give rise to goodwill. Taco Bell, of course, has an opportunity to convert a potentially substantial quantity of T-Mobile users into becoming lovers of their food.
Based on these numbers it seems less likely that a profound number of Taco Bell devotees would jump ship on their mobile provider and switch to T-Mobile for some free tacos. Diving deeper into our insights, though, will paint an ever-increasingly nuanced picture of this audience.
What Else Could Be Learned?
To those on the market for a new mobile provider, the association of the T-Mobile brand with a customer appreciation campaign, touted from the greatest pulpit available via American mass media (Super Bowl commercials) could plant the seeds of positive association, even among those unable to benefit from the Super Bowl promotion directly.
The same would also be true of Lyft and Taco Bell.
This much is known, of course, but who will be watching? Who will be paying the most attention to the broadcast? What proportion of that segment will be the most receptive to your messaging?
StatSocial’s insights can tell you what the fast food and/or car service and/or mobile communications preferences are of both your audience, and those audiences of your competitors. You can know to what degree your audience, and those of your competitors — and any other audiences whose attentions, for whatever reasons, you’d like to attract — are NFL fans, and what proportions of those audiences are fans of each team.
You can also know the ages, incomes, political leanings, favorite TV shows, podcasts, brands of soap, casinos, and… Well, you get the idea.
In short: What can be gained is invaluable wisdom into retaining the audience you already have, and attracting the audience(s) you desire.
Take a Sniff Around
We did a bunch of football related entries the past couple of weeks, and we invite you head over to the greater StatSocial blog here to check them out. While there you can also peruse the tons of other entries, offering all kinds of insights, studies, and deep dives to better acquaint you with the capabilities of StatSocial.
Throughout the blog are many examples of the sorts of insights that can only be gained with StatSocial.
We’ve calculated what portion of every NFL team’s audience is fans of Maroon 5, Travis Scott, and Big Boi. Hint: In the case of the latter two, hometown loyalty counts for a lot. Not so much with the nominal headliner, though.
The big day is truly just about upon us. Super Bowl LIII is soon to be taking place (or perhaps has occurred by the time you’re reading this). We hope you’ve been keeping up with our ever-mounting excitement, made manifest through our public application of the powerful and unfailingly insightful StatSocial audience analysis tool. We’ve been digging into the varying affinities, hobbies, preferences, and predilections of every NFL team’s fans.
Let’s Talk About Halftime Shows!
His Late Royal Badness at Super Bowl XLI
The Super Bowl has been a TV ratings juggernaut since very early in its history. Until the early-90s, though, two things about the event were largely accepted as facts: 1) For all the hoopla, the game itself would invariably be boring, and 2) the halftime show would be loud, flashy, expensive, and… mostly ignored.
Super Bowl XXV ushered in the era of good Super Bowl games. In a nail-biting, final seconds finale, Buffalo Bills’ placekicker, Scott Norwood, missed a very-nearly game-winning field goal. The play will forever be known in NFL lore as “Wide Right.” As a result, the New York Giants emerged victorious by a single point.
Good football was now on the Super Bowl table as a possibility. Halftime shows continued to be regarded as a lost cause, though. These hokey, bloated productions always had an overarching theme such as ‘World of Children’s Dreams’ and ‘Salute to Superstars of Silver Screen.’
In 1992, the theme of Super Bowl XXVI’s halftime show was ‘Winter Magic.’ It was a bit of hype for that year’s Winter Olympics in France, of which the broadcasting network, CBS, was to begin airing exclusive U.S. coverage a little over a week after the big game.
That year, the then still fledgling FOX network counter-programmed the Super Bowl’s halftime with a live episode of its critically acclaimed and award-winning sketch comedy show, ‘In Living Color’ (the show that launched the careers of numerous Wayans siblings, as well as Jamie Foxx, Jim Carrey, Jennifer Lopez, Rosie Perez, and David Alan Grier). This stunt not only netted FOX and ‘In Living Color’ tons of press, it also pulled in tons of viewers. 22 million, to be exact. Compared to the 120,000,000 who tuned into the game, only a drop in the bucket. All the same, huge numbers for any regular network show. This was not the sort of thing that was going to go ignored.
In a bid for relevancy and viewer retention, the following year’s Super Bowl XXVII had the halftime theme of… Well, there was no theme. They booked Michael Jackson. ‘Nuff said.
From there, the halftime shows took a few years of fits and starts to fully shake many of the corny trappings of spectacles past. With each passing Super Bowl, however, the proceedings ever-increasingly incorporated rock, pop, and country acts of whom members of the public born after World War II were actually fans.
McCartney, The Stones, Prince, Tom Petty, Springsteen, Aerosmith, Travis Tritt, Madonna, Clint Black, Britney Spears, and many others have, since the dawn of the halftime renaissance, done their Super Bowl duty. Whatever their demographic appeal or age, they are all quite a lot hipper than Up With People.
Nice History Lesson, Where Are the Stats?!
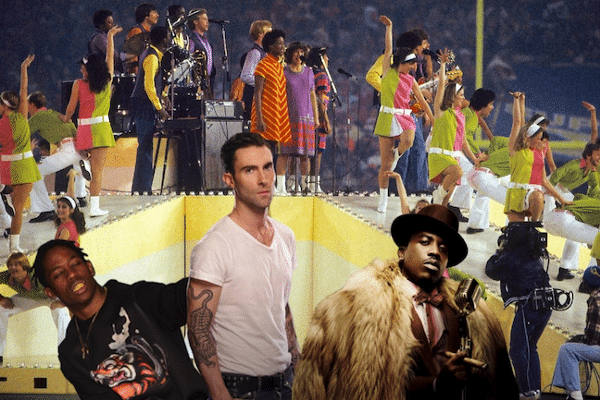
That leads us to this year. The featured performer is the rock band Maroon 5. The band’s fame has gotten a goose from frontman Adam Levine’s other gig as a judge on NBC’s hit singing competition show, ‘The Voice.’
The band is popular, whatever the reason. In an era where selling a million is a legitimate accomplishment, their 2017 release, ‘Red Pill Blues,’ reached that benchmark. Their 2014 album, ‘V,’ sold three-million copies.
Some of the controversies swirling around the league of late (to which we’ve made reference here and here) found booking acts for this year’s halftime a bit challenging. After a fair amount of speculation and drama, it has shaken out that the enormously popular Houston-based rapper, Travis Scott, will be joining Maroon 5 in the center ring. Also, in tribute to the game’s host city of Atlanta, rapper Big Boi — one half of superstar 90s/00s hip-hop duo, Outkast, and Atlanta music legend — will be joining in on the festivities.
So, To Make This a StatSocial Thing
We put the StatSocialaudience analysis tool to work, this time out, to see what each of the NFL’s teams’ fans thought of the three acts slated to appear mid-game. Using the enormous amount of data incorporated in our analysis, we were able to calculate what percentage of each squad’s devotees are also fans of each act.
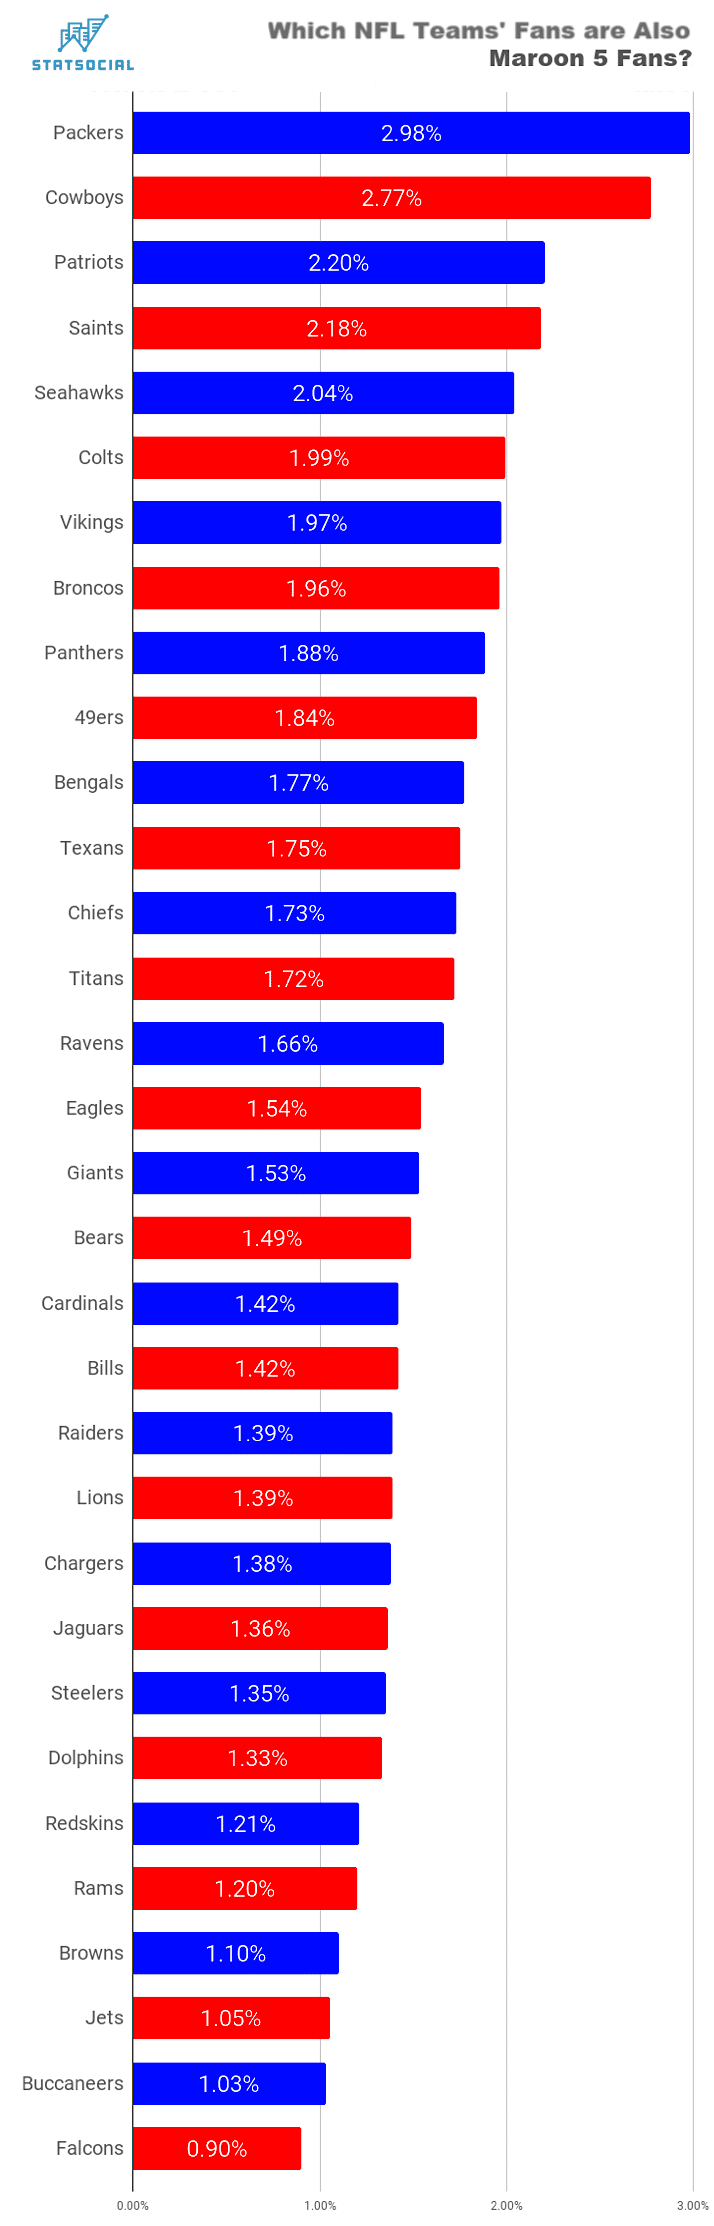
Let’s start with Maroon 5, who incidentally originate from Los Angeles.
2.91% of the Green Bay Packers’ fans are also fans of Maroon 5. 0.90% of the Atlanta Falcons’ fans are fans for Maroon 5.
It would seem football fans in the city hosting the Big Game are not the biggest fans of the band. Indeed, of all the teams’ audiences, the Falcons’ fans show the smallest degree of enthusiasm for Mr. Levine and his (presumably 4?) bandmates.
Luckily, the stadium is bound to be filled with fans of the two teams playing, and the Patriots can boast of having the largest quantity of Maroon 5 fans (Maroonies?) among their audience.
Of possible interest as we proceed, they don’t find over-abundant favor from fans of either of their current hometown teams.
Let us move on…
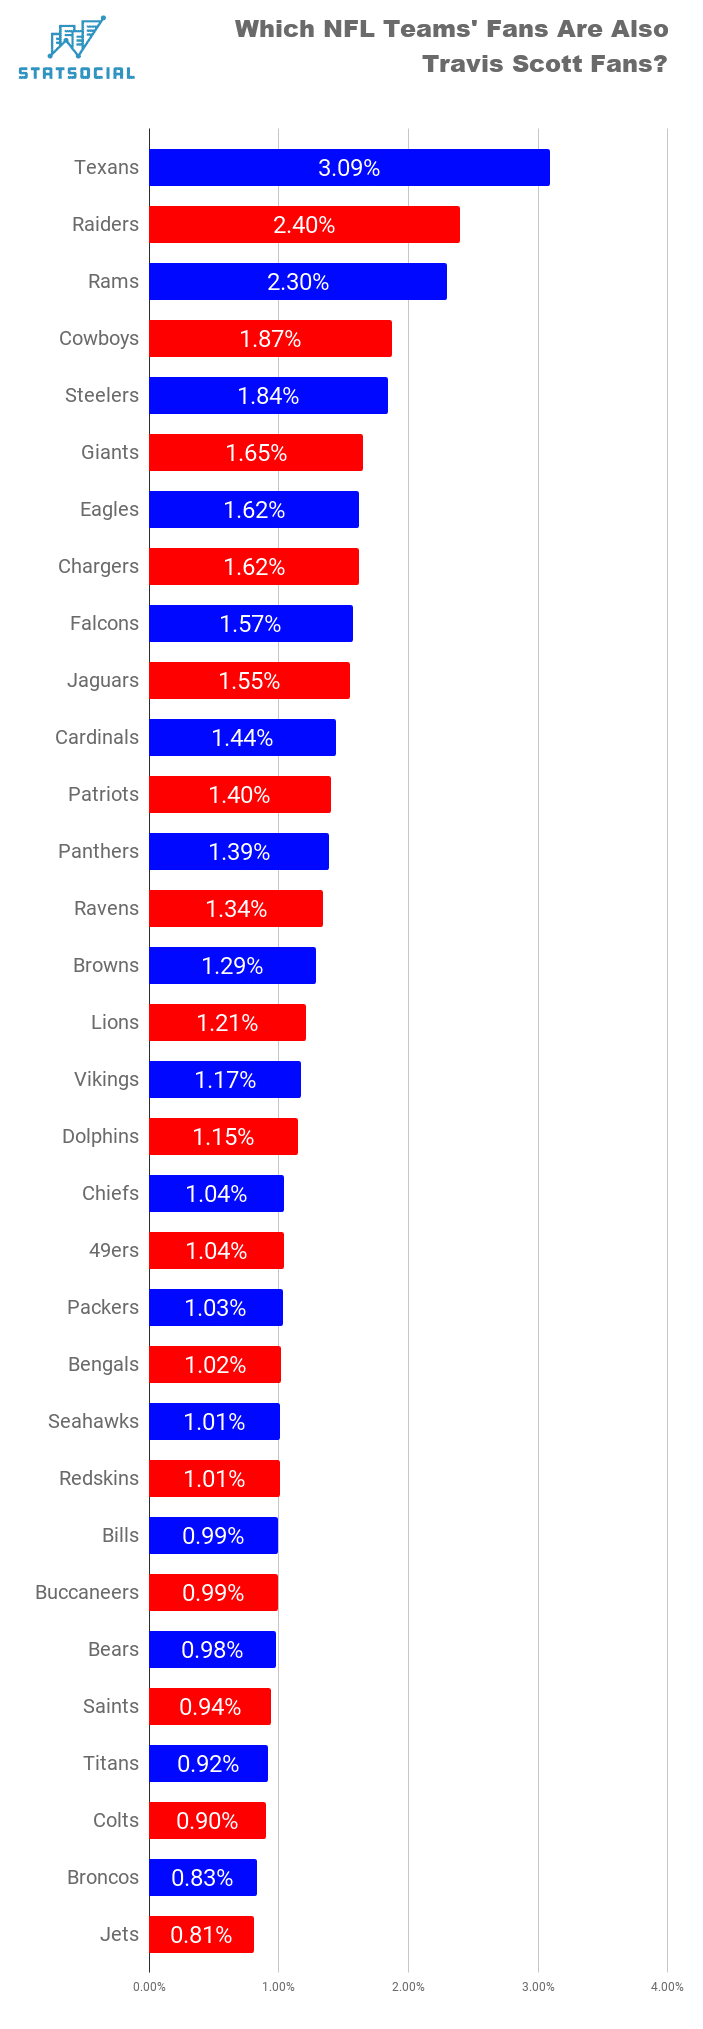
3.09% of the Green Bay Packers’ fans are also fans of Travis Scott. 0.81% of the Ne York Jets’ fans are fans of Travis Scott.
Houstonian Travis Scott finds the most love from the fans of his hometown’s Texans. Much as love from the Pats fans may work in Maroon 5’s favor, at least in Mercedes-Benz Stadium where fans of the two competing teams are sure to be present, Travis may find a number of his fans already in attendance. It seems a reasonable proportion of Rams fans dig his music.
Given that the current NFL fan base and that of Travis Scott don’t overlap to the extent you might find with fans of other sports, it’s a testament to just how popular he is that his fans can be found to notable degrees within the audiences of a great many teams.
Not so much fans of New York’s Jets, however.
Now, unsubstantiated rumors are flying that Scott will seize the opportunity of this massive event to propose to his girlfriend — reality TV star, model, and social media mega-influencer, Kylie Jenner. The league is not big on halftime show surprises (cough-wardrobemalfunction-cough), so if this is the case it will likely have been cleared, rehearsed, and Ms. Jenner’s response is already known. In other words, we don’t suspect such a thing is likely to happen.
And last, but most assuredly not least…
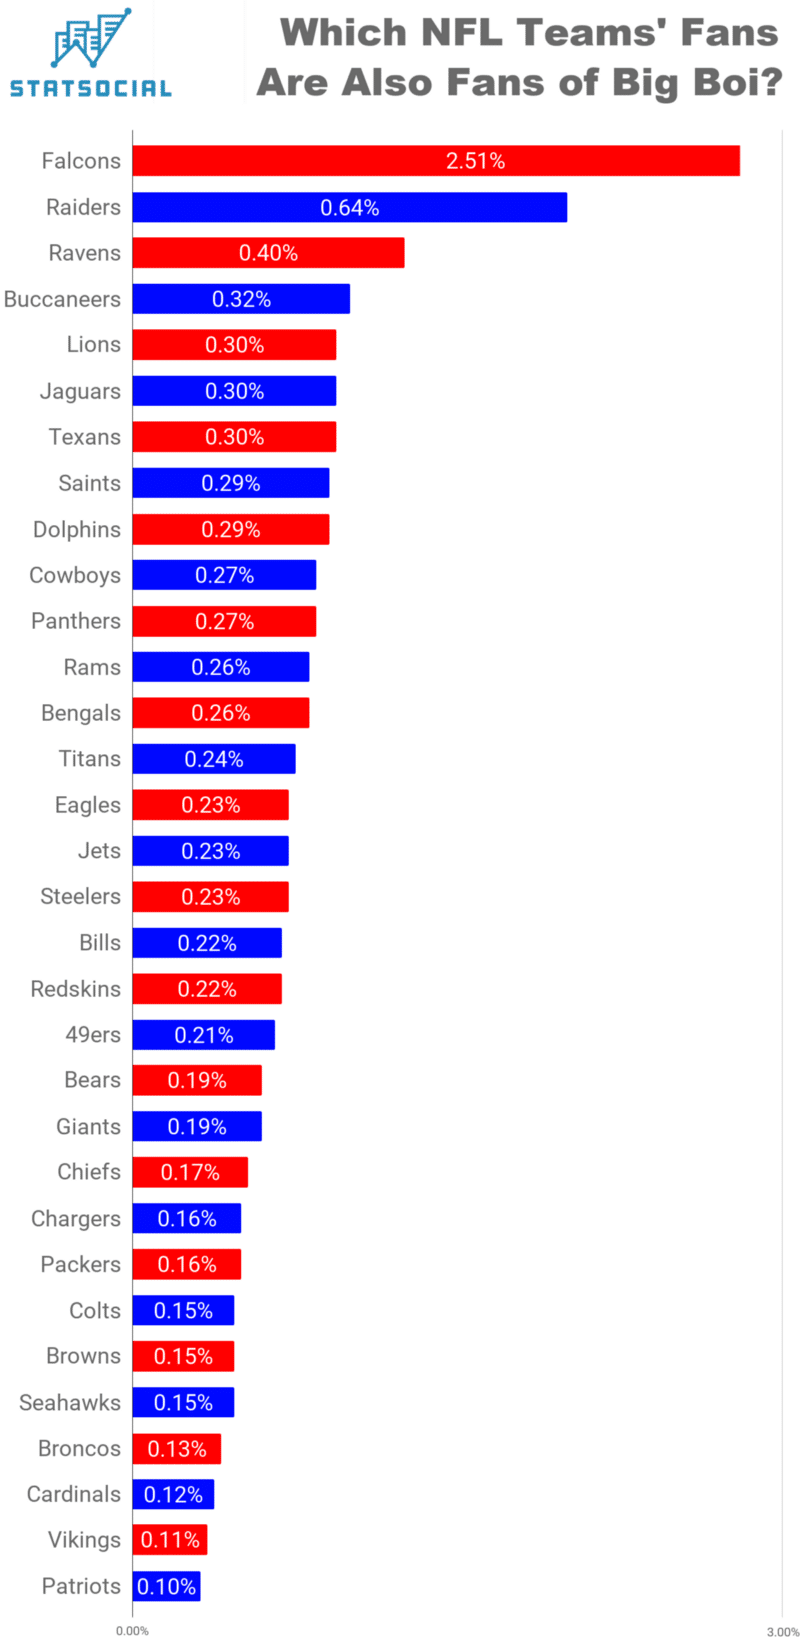
2.51% of the Atlanta Falcons’ fans are also fans of Big Boi. 0.10% of the New England Patriots’ fans are also fans of Big Boi.
Root, Root, Root for the Home team
Sworn Falcons fanatic, Antwan “Big Boi” Patton appears on ‘ESPN First Take’ in advance of the 2016–2017 NFC Championship game which found the Falcons facing the Green Bay Packers and emerging victorious.
You can check out Big Boi, on ‘ESPN First Take’ as he discusses the Falcons’ chances of winning the NFC Championship in January of 2017, by clicking here (it’s a 22 minute show, so if you have a moment). As it turns out their chances were pretty good, as they roundly trounced the Packers, 44 to 21.
Big Boi does not find a ton of admirers, in general, among the fans of the league’s other 31 squads. He particularly, though, gets no love from Pats fans. This even despite their victory over Big Boi’s beloved Falcons in Super Bowl LI. Mercedes-Benz Stadium on February 3, 2019 could be a tough room.
We sure hope some Atlantans get tickets to the Big Game, Big Boi deserves some love from the stands.
Bookmark This Page
We’ve got loads of cool entries in the pipeline, sports related and way beyond.
Head over to the StatSocial blog here, and check out the other entries in this series, plus the loads of other insights, studies, and deep dives we’ve posted.
Throughout the blog are many examples of the sorts of things that only StatSocial can tell you, particularly with such nuance and accuracy.
For their Super Bowl commercial this year, Stella Artois has resuscitated a pair of fictional embodiments of two major cities’ ethos. One is The Dude, from the Coen Brothers beloved cult favorite, ‘The Big Lebowski.’ Fittingly, fans of this year’s NFC champion Los Angeles Rams count the largest number of Jeff Bridges enthusiasts among their ranks.
Super Bowl LIII is well and fully nigh about now. As usual, there is a quantity of hype surrounding the advertisements that will run during the game that rivals the excitement for the game itself. We’ve been having a blast celebrating our great sport of American-rules football (no one really calls it that), putting our StatSocial audience analysis tool to work, analyzing the audiences of every NFL team, to see where their affinities reside when it comes to everything from beer, to politics, to theme parks, and even to being friendly.
Feel free to head over to the StatSocial blog, and check them all out for yourself.
So What’s All This Then?
A little over 20 years ago, in 1998, two very different tales of two very different cities were first told. One was the ongoing saga(s) of a New York City sex and love columnist and her three best friends. The other spun the tale of a simple Angeleno slacker finding himself embroiled in an ever-increasingly convoluted series of events as he simply sought to get his soiled rug replaced.
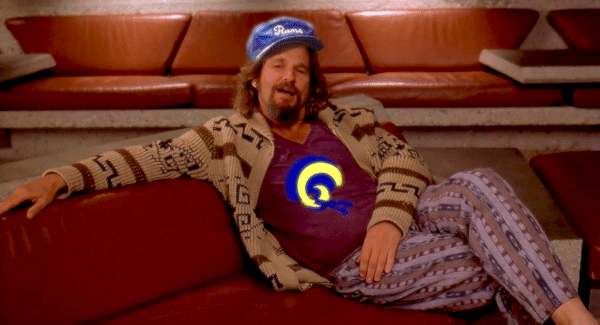
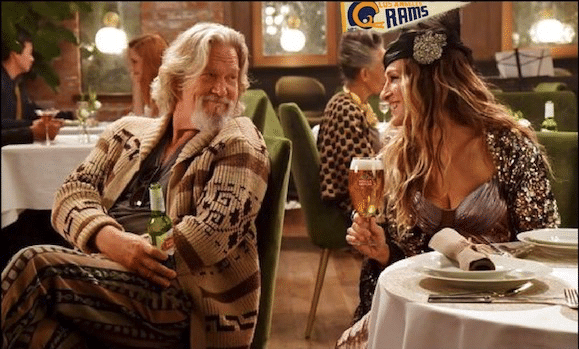
Belgian beer, Stella Artois (manufactured by Anheuser–Busch InBev here in the states) have brought back to life the protagonists from each of these properties — both inspiring an almost fanatical devotion among their respective fans — for a one minute spot that is to air during the Big Game.
For many years now, we’ve lived in a world where many — if not even most — of the spots produced for the Super Bowl are posted online well in advance of the game. This one is no exception, so you can check it out by clicking through here.
The spot features Sarah Jessica Parker reprising her role as Carrie Bradshaw, from HBO’s ‘Sex and the City.’ Parker is contrasted by Oscar winner Jeff Bridges, playing her unlikely left coast counterpart, Jeff “The Dude” Lebowski. To the few unfamiliar, that would be the main character from the Coen Brothers’ beloved cult classic comedy, ‘The Big Lebowski.’
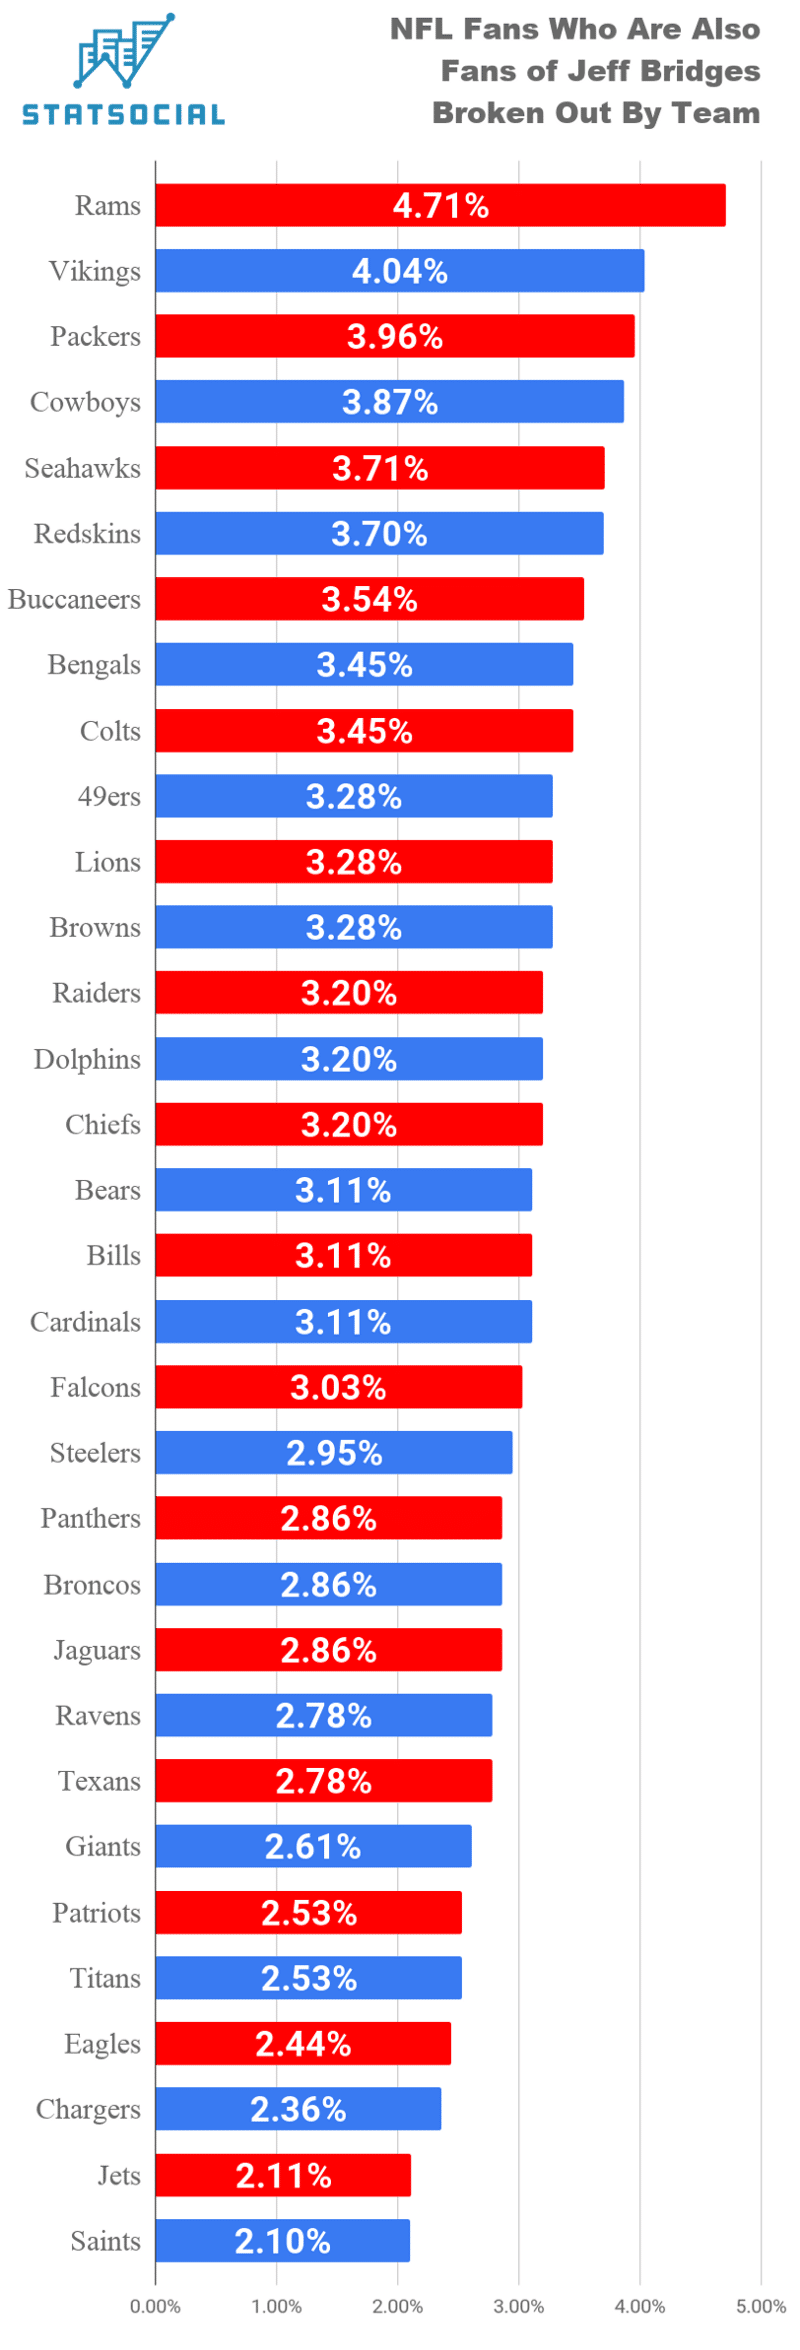
Keeping things simple this time out, we dove into the stats on the hundreds of thousands of NFL fans who also identify as fans of Jeff Bridges. From there — as you’ll see in the below graphic — we’ve broken out among which team’s fans the largest proportion of Bridges’ admirers are chilling, and went through all 32 NFL fan bases, until we reached the bunch least enamored of Lloyd Bridges’ celebrated son.
Right Where You’d Most Expect It
From both the standpoint of The Dude and Jeff Bridges himself, there is no city on Earth where you’d more expect to find affinity for either man than the City of Angels. Both Jeffs Lebowski and Bridges are distinctly and uniquely products of that oh-so uniquely American town.
Los Angeles, of course, is not a city with just one NFL team. Gather ‘round kids, and we’ll tell you a story. You may think of the Rams as a team who came to Los Angeles from St. Louis. This is technically not incorrect, but that Gateway City tenure was just a 20 year stopover. To the Jeff Lebowskis of this world, the Rams are Los Angeles’ NFL team, and the Chargers belong to San Diego.
Why New Orleans seems comparably distant in their affection for Mr. Bridges is not entirely knowable to us when observing these findings in isolation. As the great city did play host to the annual, and quite well attended, Lebowskifest, on at least one occasion, we’re left to ponder if their issues are non-The Dude related. Perhaps they took umbrage with elements of ‘Tron’ or ‘Tucker.’
Bookmark This Page
We’ll be visiting numerous subjects of this general nature — all highlighting the rich and varied affinities of each NFL team’s fans — in the days running up to Super Bowl LIII.
And check out the written matter in the footer, and reach out to us if you have any questions or would like to see much, much more.
We use cookies on our website to give you the most relevant experience by remembering your preferences and repeat visits. By clicking “Accept All”, you consent to the use of ALL the cookies. However, you may visit "Cookie Settings" to provide a controlled consent.
This website uses cookies to improve your experience while you navigate through the website. Out of these, the cookies that are categorized as necessary are stored on your browser as they are essential for the working of basic functionalities of the website. We also use third-party cookies that help us analyze and understand how you use this website. These cookies will be stored in your browser only with your consent. You also have the option to opt-out of these cookies. But opting out of some of these cookies may affect your browsing experience.
Necessary cookies are absolutely essential for the website to function properly. These cookies ensure basic functionalities and security features of the website, anonymously.
Cookie
Duration
Description
cookielawinfo-checkbox-analytics
11 months
This cookie is set by GDPR Cookie Consent plugin. The cookie is used to store the user consent for the cookies in the category "Analytics".
cookielawinfo-checkbox-functional
11 months
The cookie is set by GDPR cookie consent to record the user consent for the cookies in the category "Functional".
cookielawinfo-checkbox-necessary
11 months
This cookie is set by GDPR Cookie Consent plugin. The cookies is used to store the user consent for the cookies in the category "Necessary".
cookielawinfo-checkbox-others
11 months
This cookie is set by GDPR Cookie Consent plugin. The cookie is used to store the user consent for the cookies in the category "Other.
cookielawinfo-checkbox-performance
11 months
This cookie is set by GDPR Cookie Consent plugin. The cookie is used to store the user consent for the cookies in the category "Performance".
viewed_cookie_policy
11 months
The cookie is set by the GDPR Cookie Consent plugin and is used to store whether or not user has consented to the use of cookies. It does not store any personal data.
Functional cookies help to perform certain functionalities like sharing the content of the website on social media platforms, collect feedbacks, and other third-party features.
Performance cookies are used to understand and analyze the key performance indexes of the website which helps in delivering a better user experience for the visitors.
Analytical cookies are used to understand how visitors interact with the website. These cookies help provide information on metrics the number of visitors, bounce rate, traffic source, etc.
Advertisement cookies are used to provide visitors with relevant ads and marketing campaigns. These cookies track visitors across websites and collect information to provide customized ads.